Earnings Presentation Q2 2020
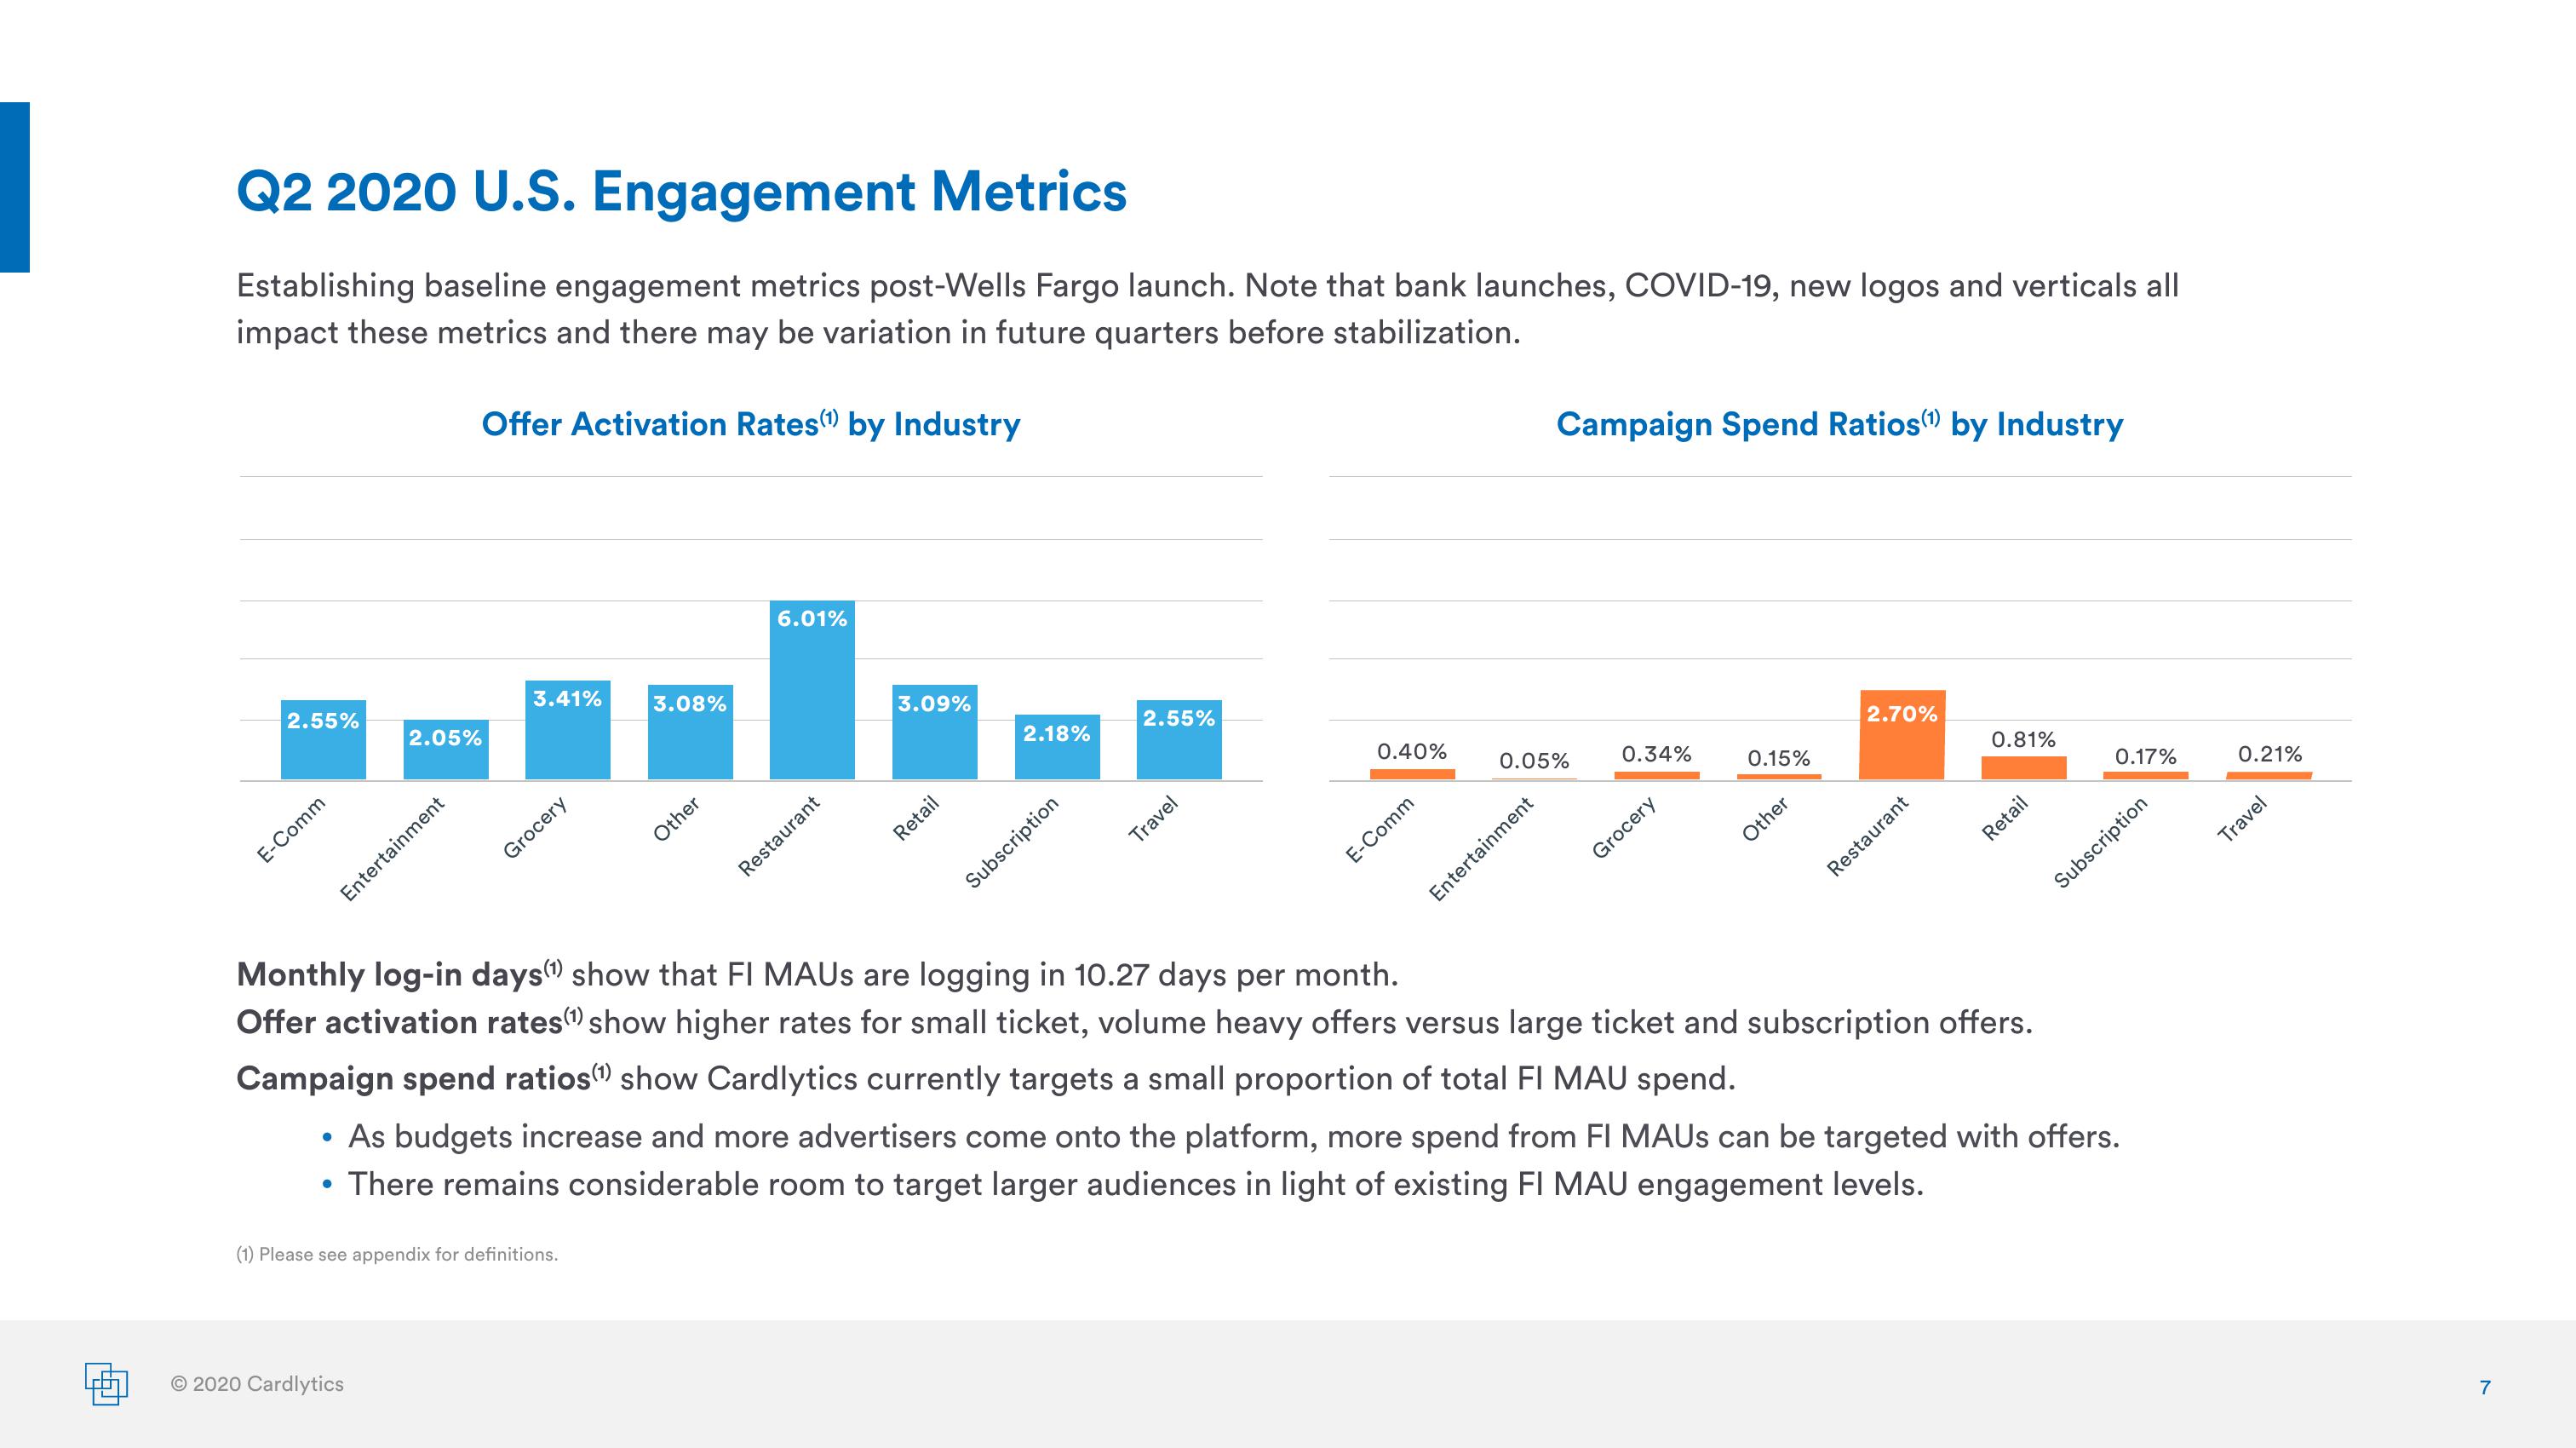
Q2 2020 U.S. Engagement Metrics
Establishing baseline engagement metrics post-Wells Fargo launch. Note that bank launches, COVID-19, new logos and verticals all
impact these metrics and there may be variation in future quarters before stabilization.
Offer Activation Rates(¹) by Industry
2.55%
E-Comm
2.05%
Entertainment
3.41%
Grocery
© 2020 Cardlytics
3.08%
(1) Please see appendix for definitions.
Other
6.01%
Restaurant
3.09%
Retail
2.18%
Subscription
2.55%
Travel
0.40%
E-Comm
Campaign Spend Ratios(¹) by Industry
0.05%
Entertainment
0.34%
Grocery
0.15%
Other
2.70%
Restaurant
0.81%
Monthly log-in days(¹) show that FI MAUs are logging in 10.27 days per month.
Offer activation rates(¹) show higher rates for small ticket, volume heavy offers versus large ticket and subscription offers.
Campaign spend ratios(¹) show Cardlytics currently targets a small proportion of total FI MAU spend.
Retail
• As budgets increase and more advertisers come onto the platform, more spend from FI MAUS can be targeted with offers.
• There remains considerable room to target larger audiences in light of existing FI MAU engagement levels.
0.17%
Subscription
0.21%
Travel
7View entire presentation