dLocal Investor Day Presentation Deck
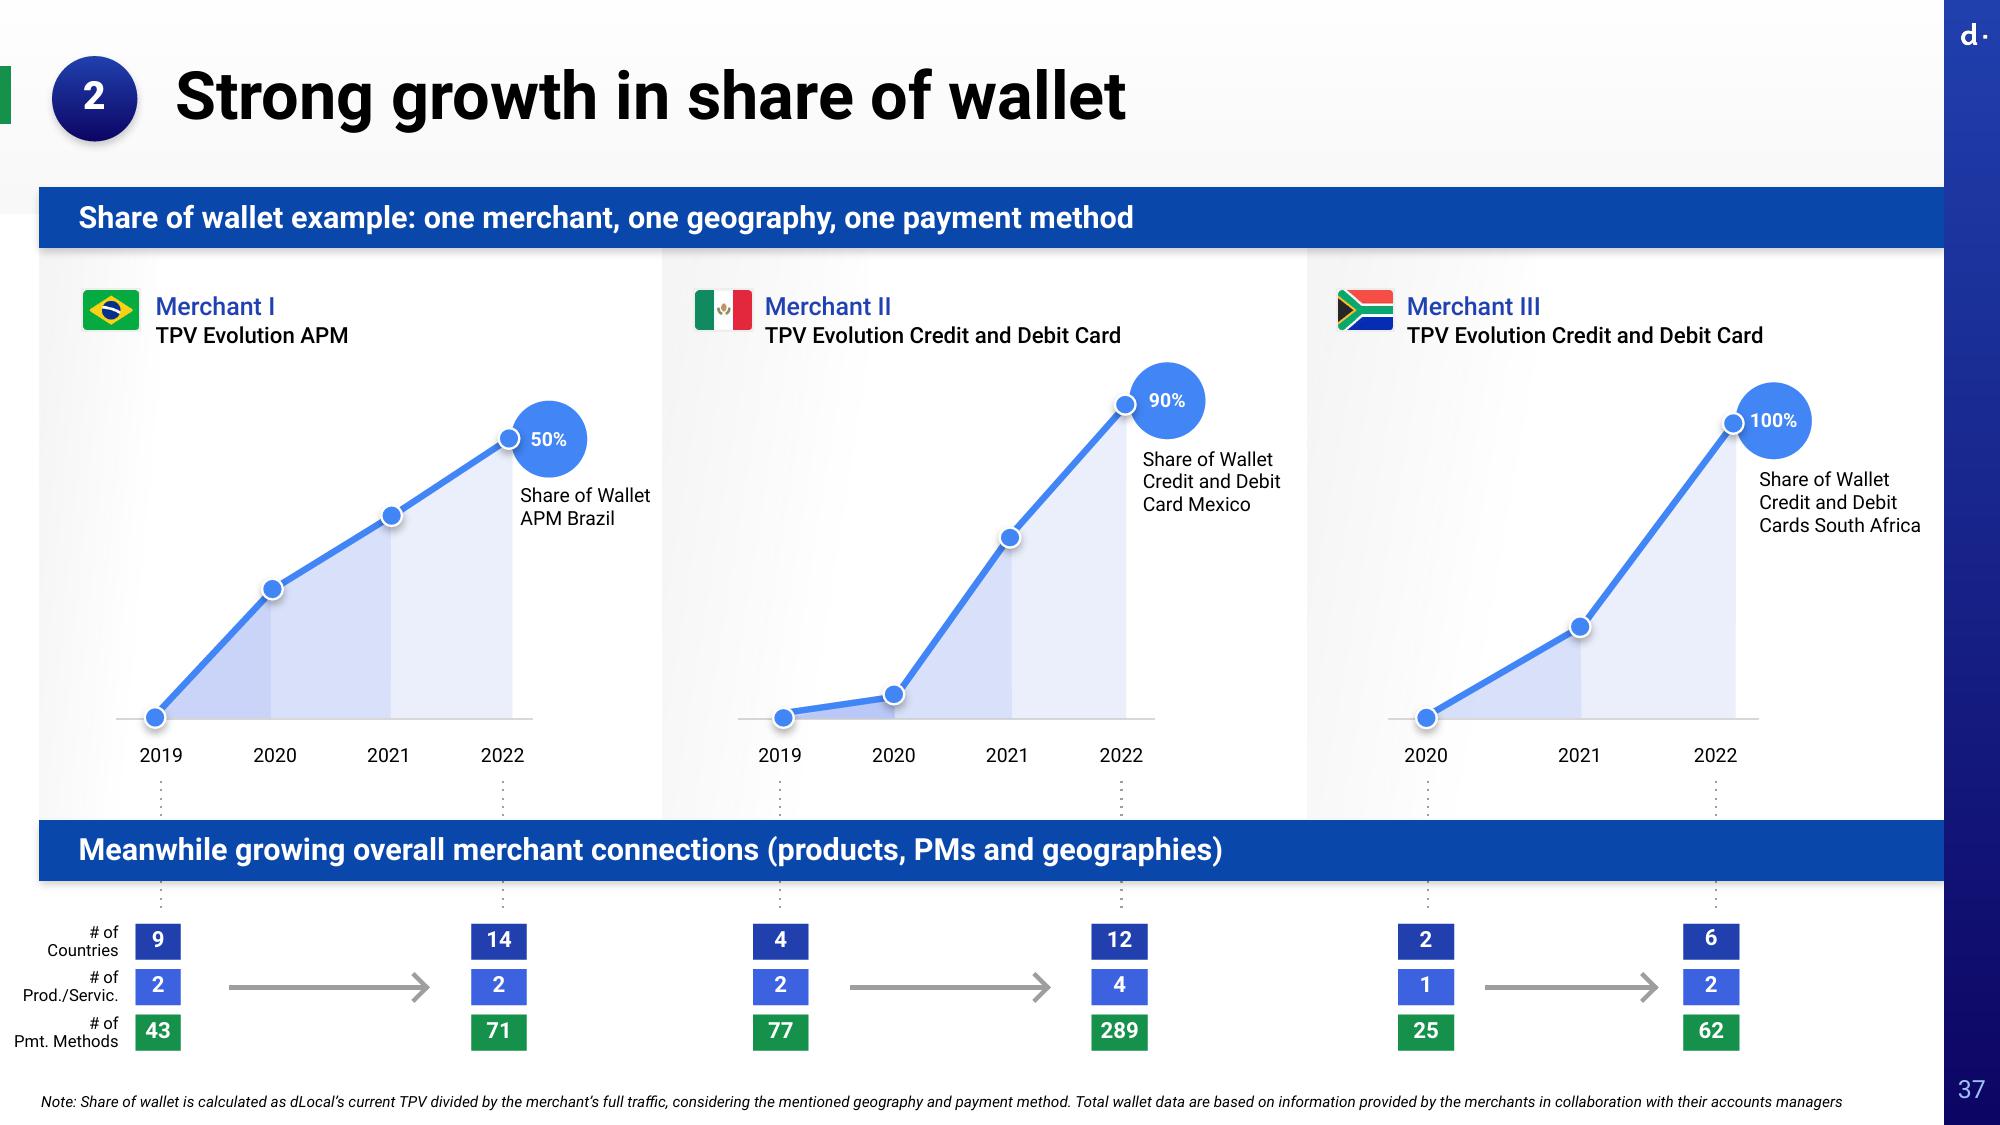
12 Strong growth in share of wallet
Share of wallet example: one merchant, one geography, one payment method
# of
Countries
# of
Prod./Servic.
Merchant I
TPV Evolution APM
# of
Pmt. Methods
2019
2020
9
2
43
2021
2022
50%
Share of Wallet
APM Brazil
14
2
71
&
Merchant II
TPV Evolution Credit and Debit Card
2019
Meanwhile growing overall merchant connections (products, PMs and geographies)
4
2
2020
77
2021
2022
90%
Share of Wallet
Credit and Debit
Card Mexico
12
4
289
Merchant III
TPV Evolution Credit and Debit Card
2020
2
1
25
2021
2022
6
2
62
100%
Share of Wallet
Credit and Debit
Cards South Africa
Note: Share of wallet is calculated as dLocal's current TPV divided by the merchant's full traffic, considering the mentioned geography and payment method. Total wallet data are based on information provided by the merchants in collaboration with their accounts managers
d.
37View entire presentation