BAT Investor Conference Presentation Deck
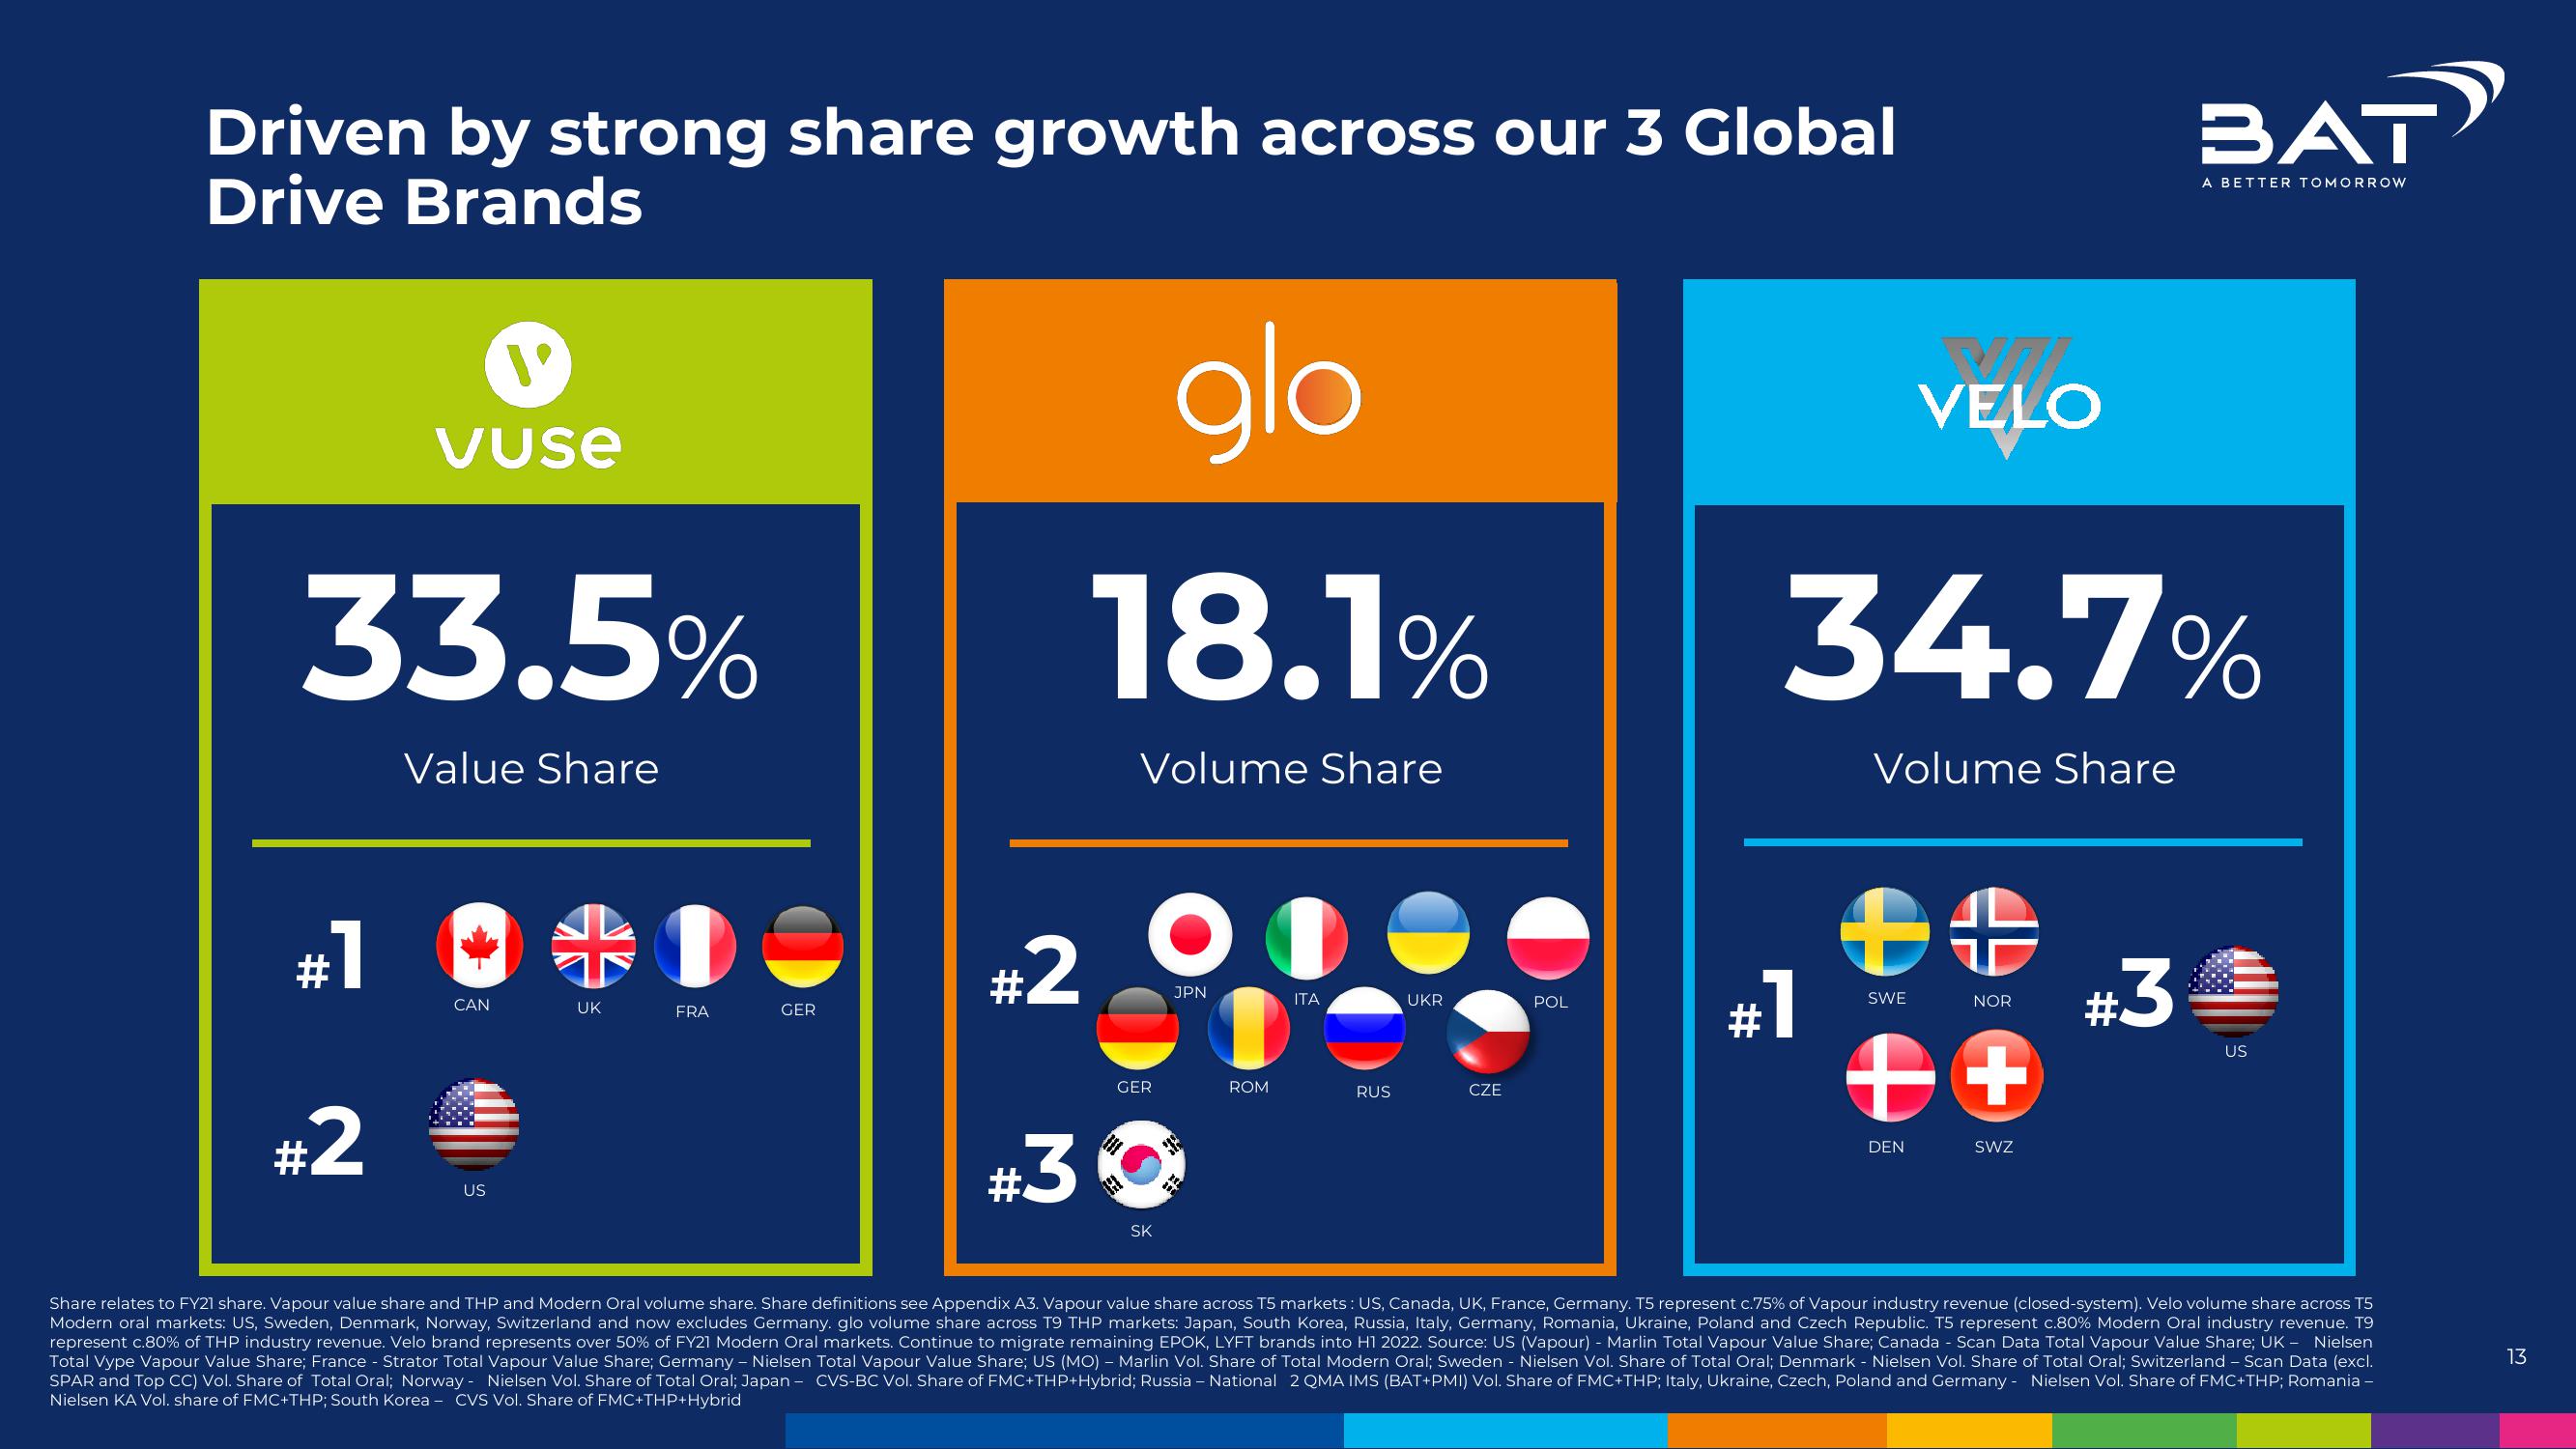
Driven by strong share growth across our 3 Global
Drive Brands
vuse
33.5%
#1
#2
Value Share
CAN
US
UK
DE
FRA
GER
#2
#3
glo
18.1%
Volume Share
GER
SK
JPN
●
ITA
ROM
RUS
UKR
CZE
POL
#1
RM
VELO
34.7%
Volume Share
++
SWE
DEN
NOR
++
SWZ
BAT
#3
A BETTER TOMORROW
US
Share relates to FY21 share. Vapour value share and THP and Modern Oral volume share. Share definitions see Appendix A3. Vapour value share across T5 markets: US, Canada, UK, France, Germany. T5 represent c.75% of Vapour industry revenue (closed-system). Velo volume share across T5
Modern oral markets: US, Sweden, Denmark, Norway, Switzerland and now excludes Germany. glo volume share across T9 THP markets: Japan, South Korea, Russia, Italy, Germany, Romania, Ukraine, Poland and Czech Republic. T5 represent c.80% Modern Oral industry revenue. T9
represent c.80% of THP industry revenue. Velo brand represents over 50% of FY21 Modern Oral markets. Continue to migrate remaining EPOK, LYFT brands into H1 2022. Source: US (Vapour) - Marlin Total Vapour Value Share; Canada - Scan Data Total Vapour Value Share; UK- Nielsen
Total Vype Vapour Value Share; France - Strator Total Vapour Value Share; Germany - Nielsen Total Vapour Value Share; US (MO) - Marlin Vol. Share of Total Modern Oral; Sweden - Nielsen Vol. Share of Total Oral; Denmark - Nielsen Vol. Share of Total Oral; Switzerland - Scan Data (excl.
SPAR and Top CC) Vol. Share of Total Oral; Norway - Nielsen Vol. Share of Total Oral; Japan - CVS-BC Vol. Share of FMC+THP+Hybrid; Russia - National 2 QMA IMS (BAT+PMI) Vol. Share of FMC+THP; Italy, Ukraine, Czech, Poland and Germany - Nielsen Vol. Share of FMC+THP; Romania -
Nielsen KA Vol. share of FMC+THP; South Korea - CVS Vol. Share of FMC+THP+Hybrid
13View entire presentation