GlobalFoundries Investor Day Presentation Deck
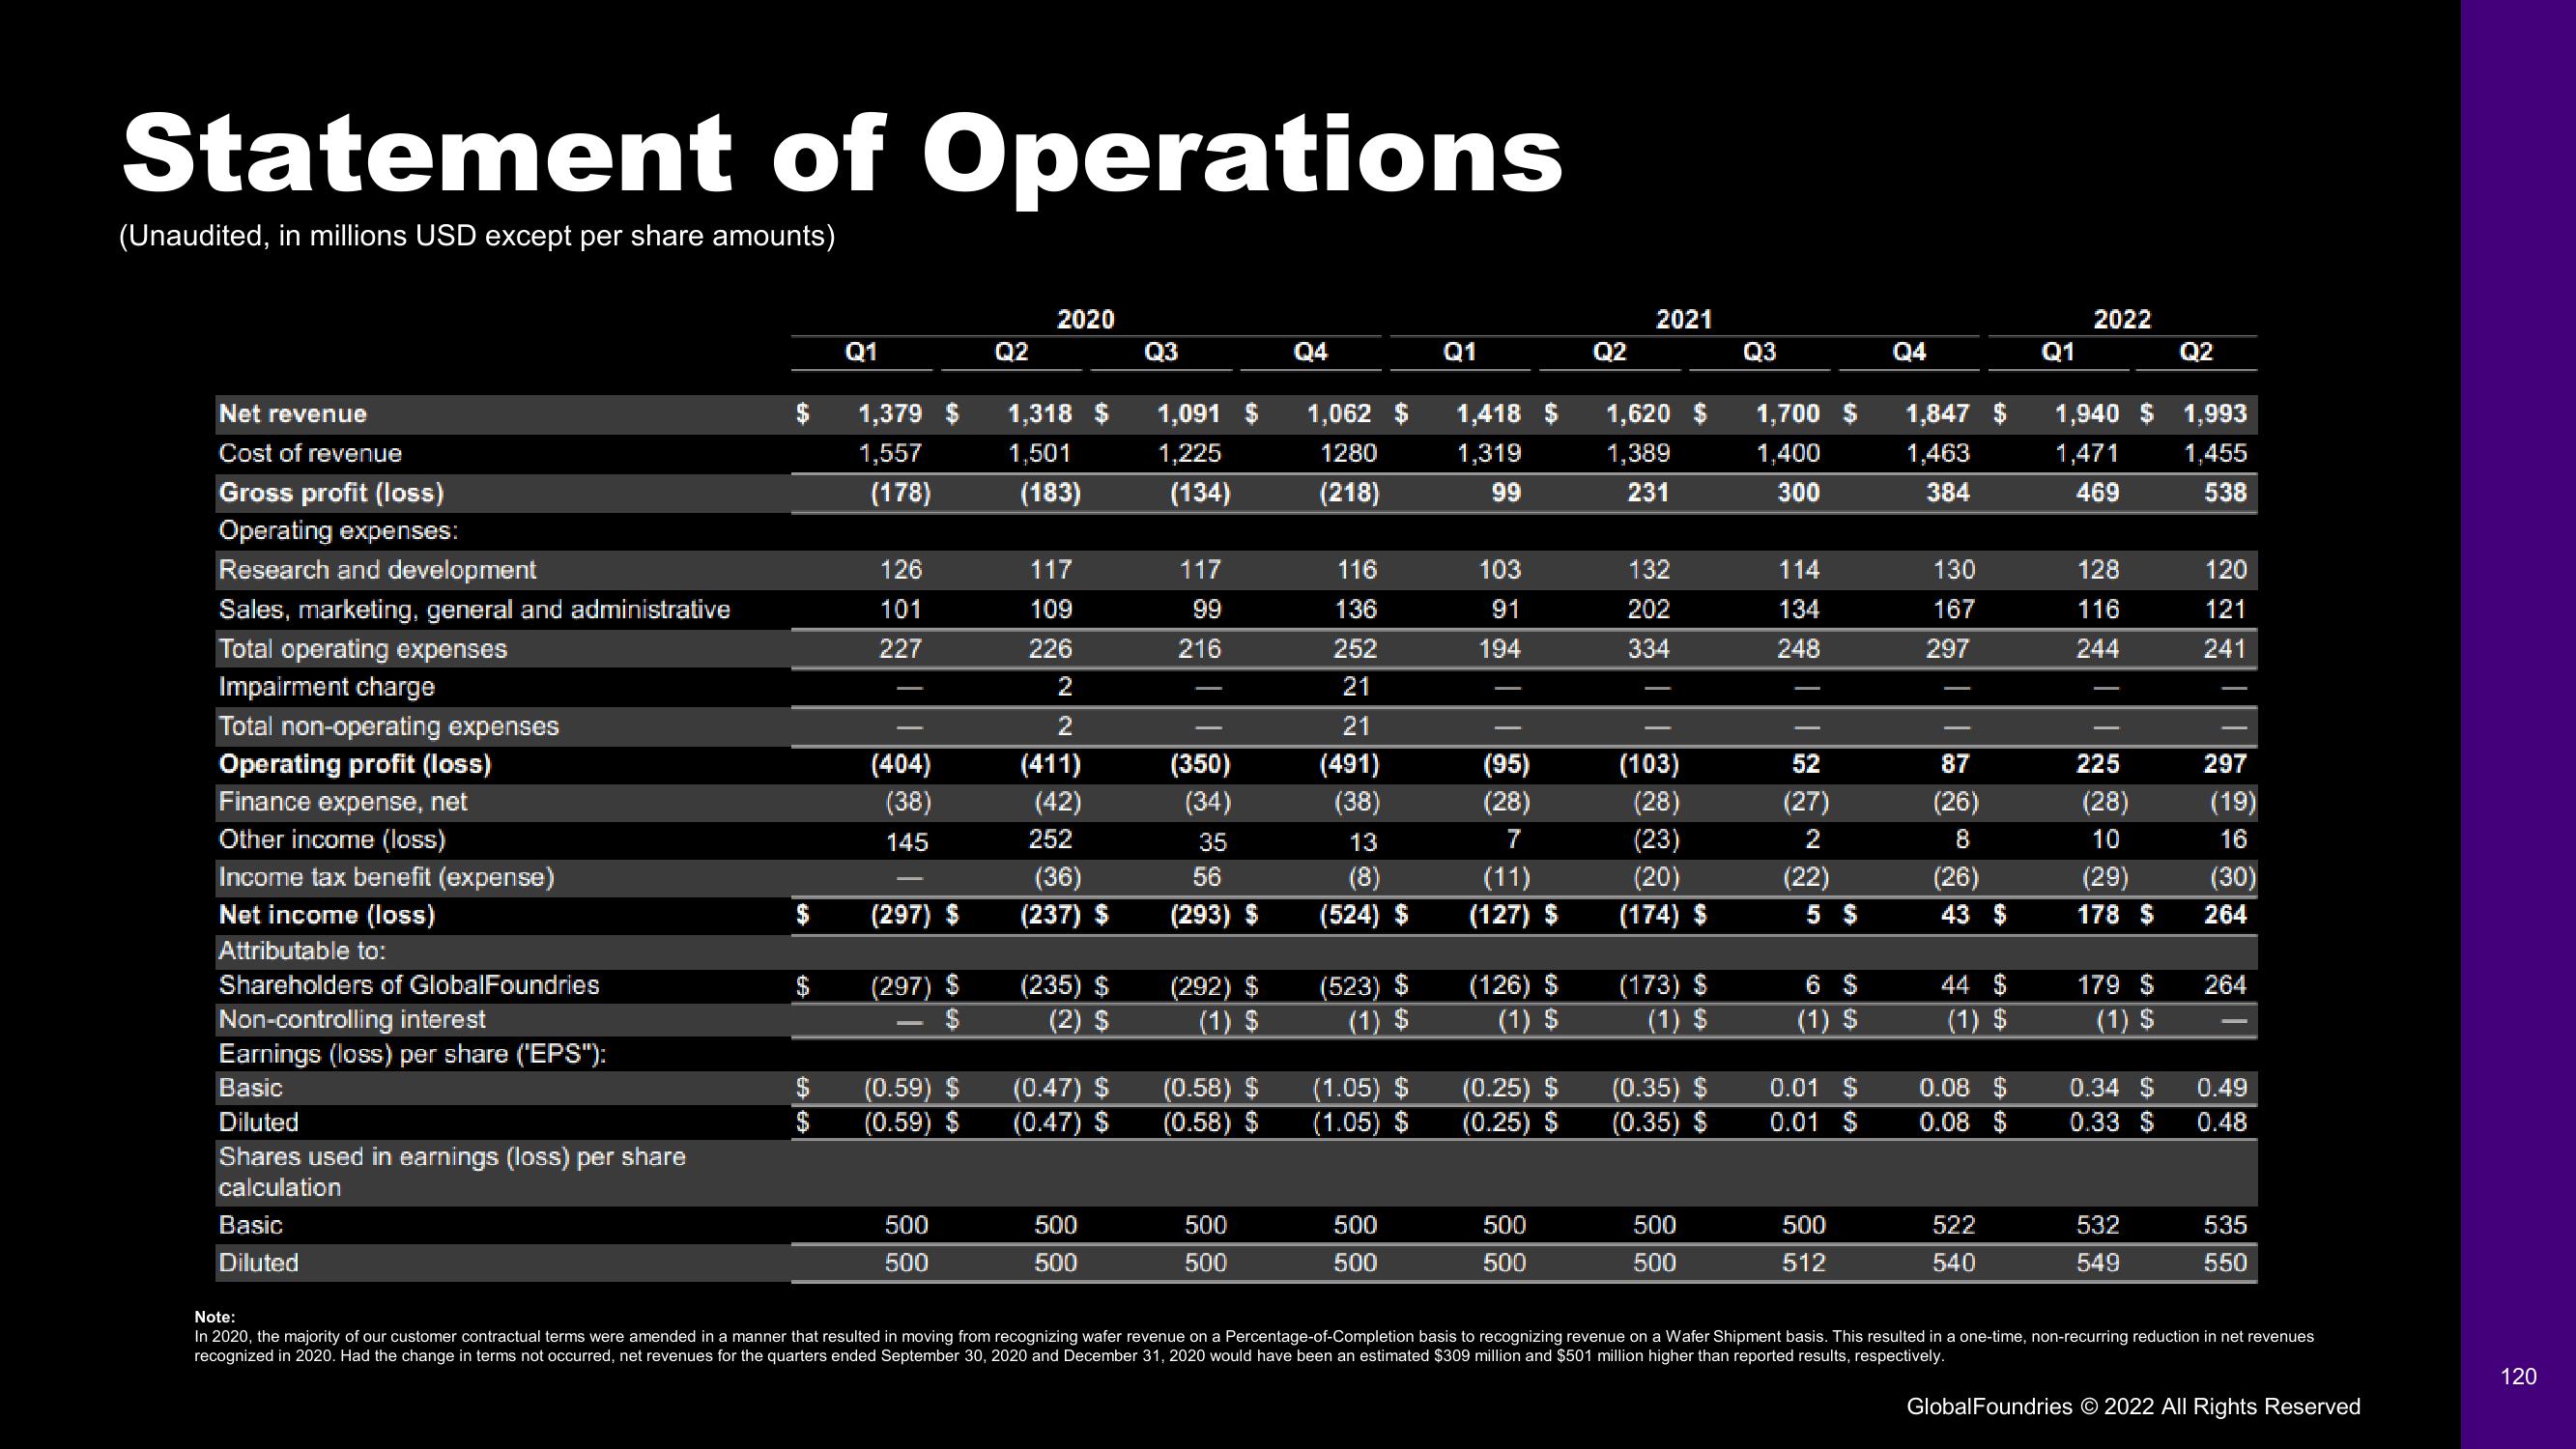
Statement of Operations
(Unaudited, in millions USD except per share amounts)
Net revenue
Cost of revenue
Gross profit (loss)
Operating expenses:
Research and development
Sales, marketing, general and administrative
Total operating expenses
Impairment charge
Total non-operating expenses
Operating profit (loss)
Finance expense, net
Other income (loss)
Income tax benefit (expense)
Net income (loss)
Attributable to:
Shareholders of GlobalFoundries
Non-controlling interest
Earnings (loss) per share ("EPS"):
Basic
Diluted
Shares used in earnings (loss) per share
calculation
Basic
Diluted
$
6A6A
$
$
Q1
1,379 $
1,557
(178)
126
101
227
(404)
(38)
145
(297) $
(297) $
SA
(0.59) $
(0.59) $
500
500
Q2
2020
1,318 $
1,501
(183)
117
109
226
2
2
(411)
(42)
252
(36)
(237) $
(235) $
(2) $
(0.47) $
(0.47) $
500
500
Q3
1,091 $
1,225
(134)
117
99
216
(350)
(34)
35
56
(293) $
(292) $
(1) $
(0.58) $
(0.58) $
500
500
Q4
1,062 $
1280
(218)
116
136
252
21
21
(491)
(38)
13
(8)
(524) $
(523) $
(1) $
(1.05) $
(1.05) $
500
500
Q1
1,418 $
1,319
99
103
91
194
(95)
(28)
7
(11)
(127) $
(126) $
(1) $
(0.25) $
(0.25) $
500
500
Q2
2021
1,620 $
1,389
231
132
202
334
(103)
(28)
(23)
(20)
(174) $
(173) $
(1) $
(0.35) $
(0.35) $
500
500
Q3
1,700 $
1,400
300
114
134
248
I
52
(27)
2
(22)
5 $
6 $
(1) $
0.01 S
0.01 $
500
512
Q4
1,847 $
1,463
384
130
167
297
T
87
(26)
8
(26)
43 $
44 $
(1) $
0.08 $
0.08 $
522
540
Q1
2022
1,940 $ 1,993
1,471
1,455
469
538
128
116
244
225
(28)
10
(29)
178 $
179 $
(1) $
0.34 S
0.33 $
Q2
532
549
120
121
241
297
(19)
16
(30)
264
264
0.49
0.48
535
550
Note:
In 2020, the majority of our customer contractual terms were amended in a manner that resulted in moving from recognizing wafer revenue on a Percentage-of-Completion basis to recognizing revenue on a Wafer Shipment basis. This resulted in a one-time, non-recurring reduction in net revenues
recognized in 2020. Had the change in terms not occurred, net revenues for the quarters ended September 30, 2020 and December 31, 2020 would have been an estimated $309 million and $501 million higher than reported results, respectively.
Global Foundries © 2022 All Rights Reserved
120View entire presentation