Ginkgo Results Presentation Deck
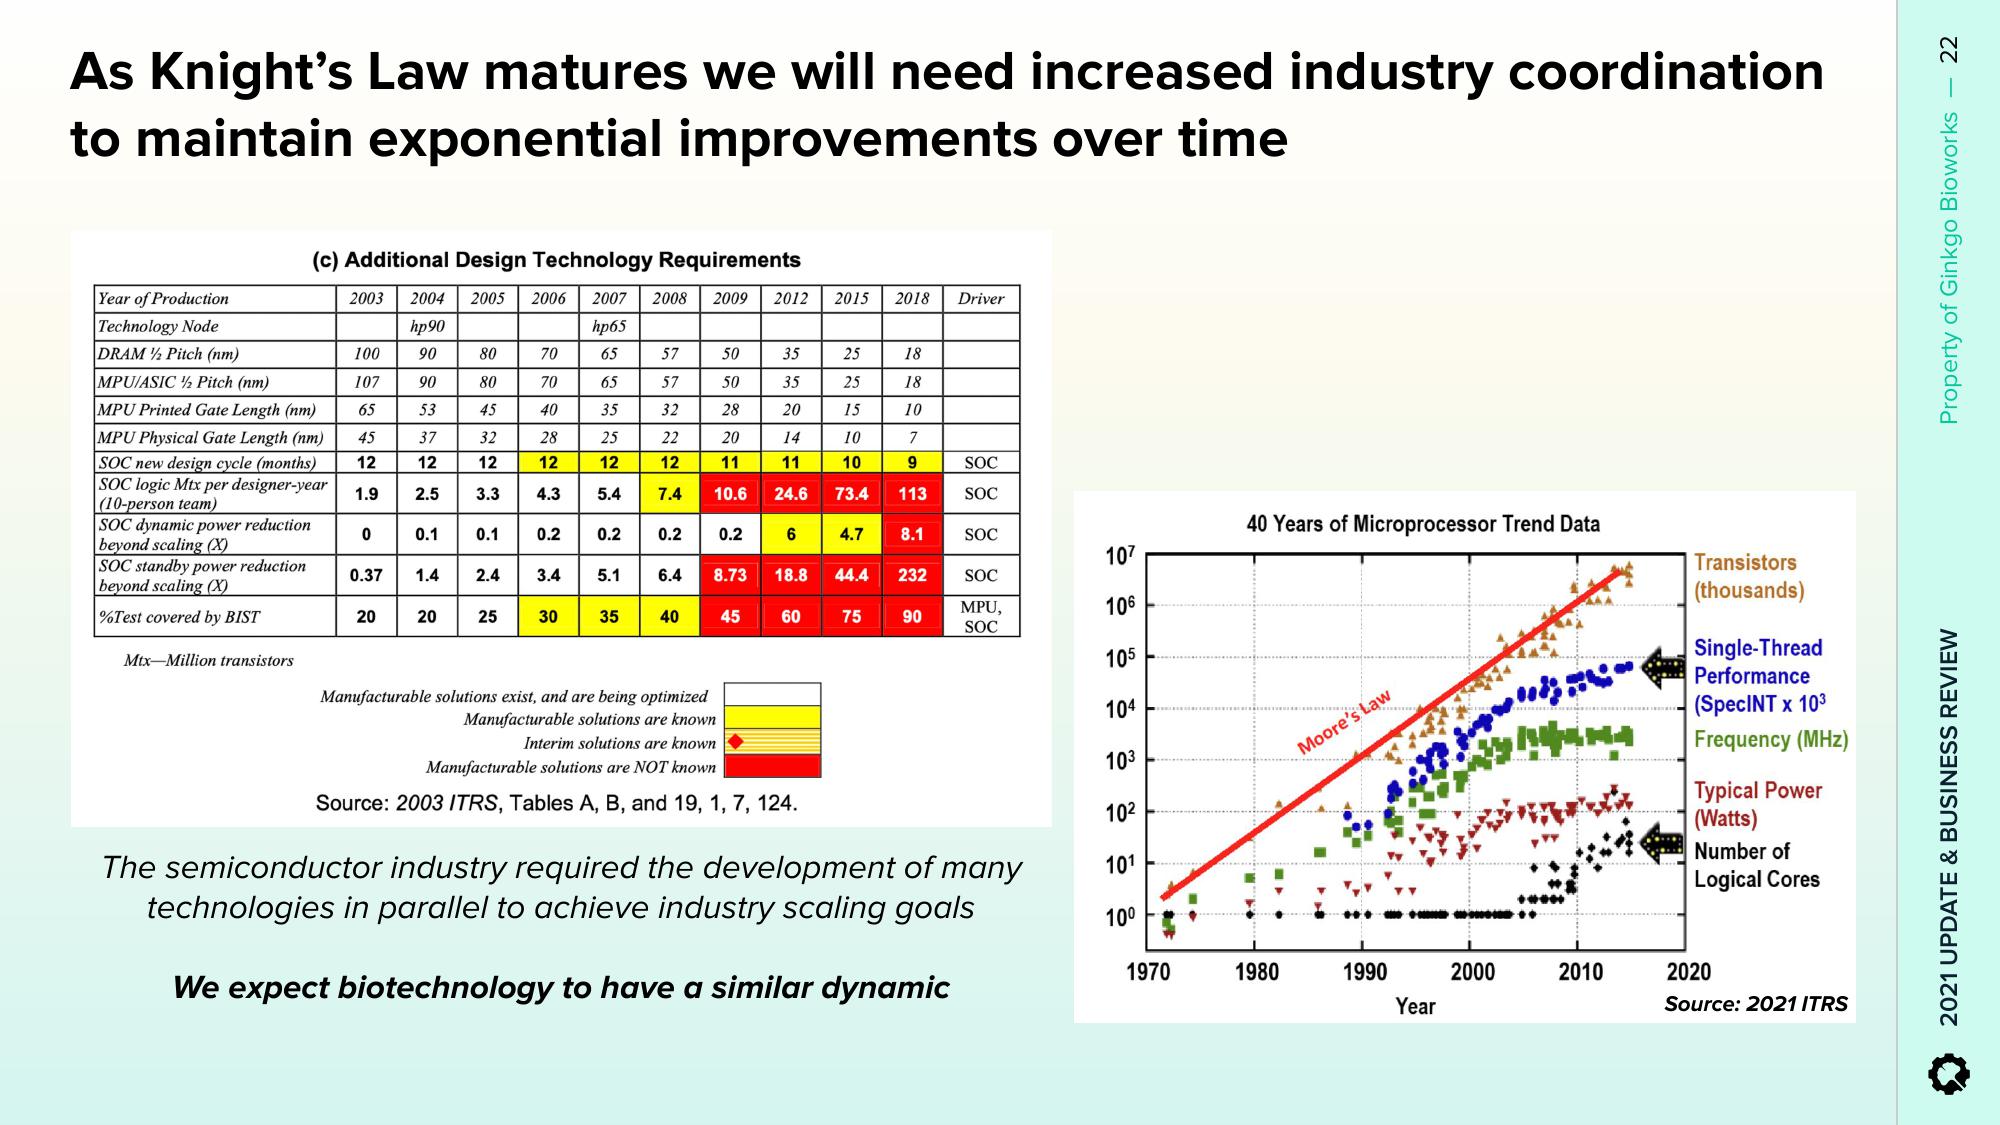
As Knight's Law matures we will need increased industry coordination
to maintain exponential improvements over time
Year of Production
Technology Node
(c) Additional Design Technology Requirements
2003 2004 2005 2006 2007 2008 2009 2012 2015 2018
hp90
hp65
90
65
DRAM 2 Pitch (nm)
MPU/ASIC 2 Pitch (nm)
MPU Printed Gate Length (nm)
MPU Physical Gate Length (nm)
SOC new design cycle (months)
SOC logic Mtx per designer-year
(10-person team)
SOC dynamic power reduction
beyond scaling (X)
SOC standby power reduction
beyond scaling (X)
%Test covered by BIST
Mtx-Million transistors
100
107
65
45
12
1.9
0
0.37
20
90
53
7 12 251 14 20
37
0.1
80
80
45
32
12
3.3
0.1
2.4
25
70
70
40
28
12
4.3
0.2
3.4
30
65
35
25
5.4
0.2
5.1
35
57
57
32
22
20
12
11
7.4 10.6
0.2
6.4
40
50
50
28
Manufacturable solutions exist, and are being optimized
Manufacturable solutions are known
0.2
8.73
45
35
35
20
14
24.6
6
18.8
60
Interim solutions are known
Manufacturable solutions are NOT known
Source: 2003 ITRS, Tables A, B, and 19, 1, 7, 124.
25
25
15
10
10
73.4 113
4.7
18
18
10
~~~
75
7
T
8.1
44.4 232
90
Driver
SOC
SOC
SOC
SOC
MPU,
SOC
The semiconductor industry required the development of many
technologies in parallel to achieve industry scaling goals
We expect biotechnology to have a similar dynamic
107
106
105
104
103
10²
101
10⁰
1970
40 Years of Microprocessor Trend Data
1980
Moore's Law
444
1990
Year
प्रक
2000
2010
Transistors
(thousands)
Single-Thread
Performance
(SpecINT x 103
Frequency (MHz)
Typical Power
(Watts)
Number of
Logical Cores
2020
Source: 2021 ITRS
22
Property of Ginkgo Bioworks
2021 UPDATE & BUSINESS REVIEWView entire presentation