dLocal Results Presentation Deck
Revenue
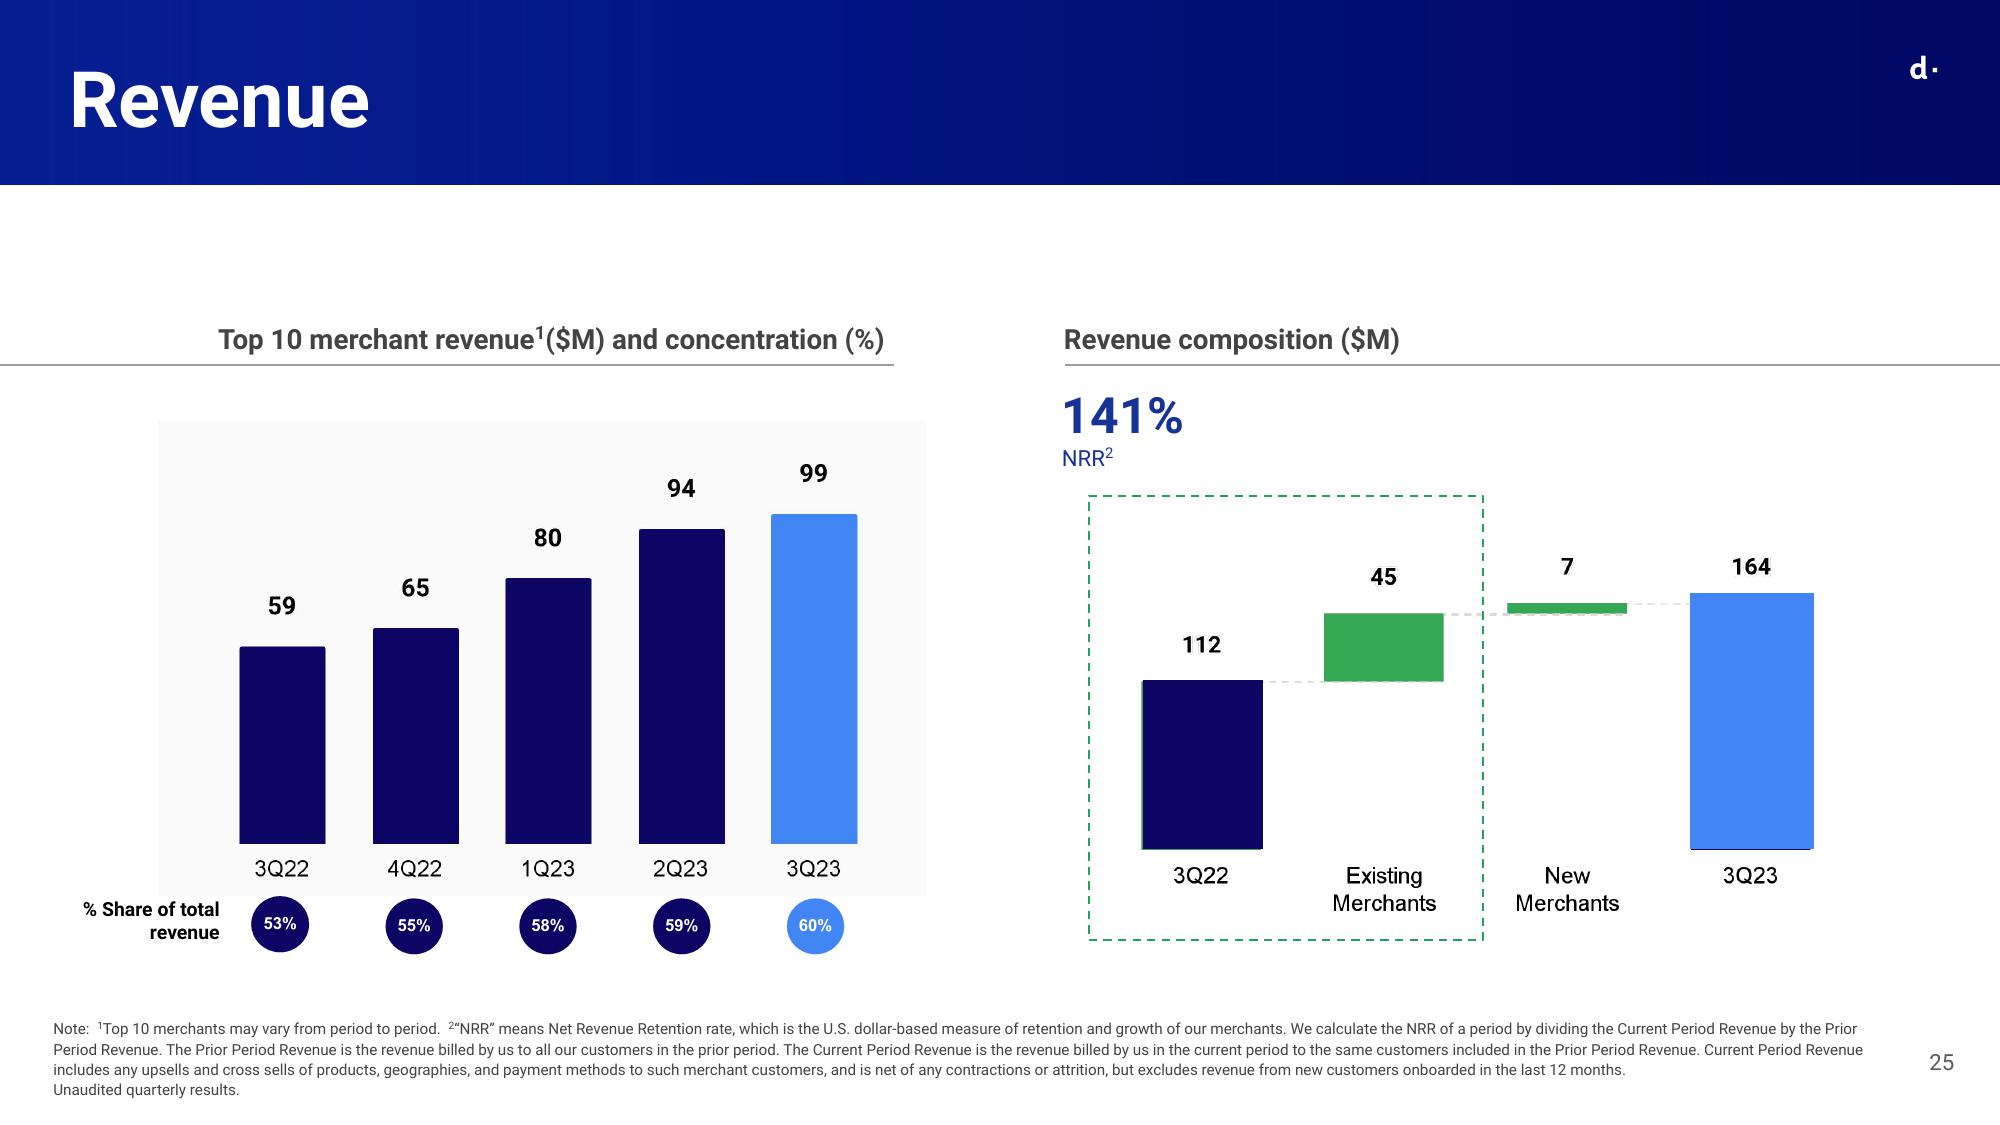
Top 10 merchant revenue¹($M) and concentration (%)
% Share of total
revenue
59
3Q22
53%
65
4Q22
55%
80
1Q23
58%
94
2Q23
59%
99
3Q23
60%
Revenue composition ($M)
141%
NRR²
112
3Q22
45
Existing
Merchants
7
New
Merchants
164
3Q23
Note: ¹Top 10 merchants may vary from period to period. 2"NRR" means Net Revenue Retention rate, which is the U.S. dollar-based measure of retention and growth of our merchants. We calculate the NRR of a period by dividing the Current Period Revenue by the Prior
Period Revenue. The Prior Period Revenue is the revenue billed by us to all our customers in the prior period. The Current Period Revenue is the revenue billed by us in the current period to the same customers included in the Prior Period Revenue. Current Period Revenue
includes any upsells and cross sells of products, geographies, and payment methods to such merchant customers, and is net of any contractions or attrition, but excludes revenue from new customers onboarded in the last 12 months.
Unaudited quarterly results.
d.
25View entire presentation