3Q20 Earnings Call Presentation
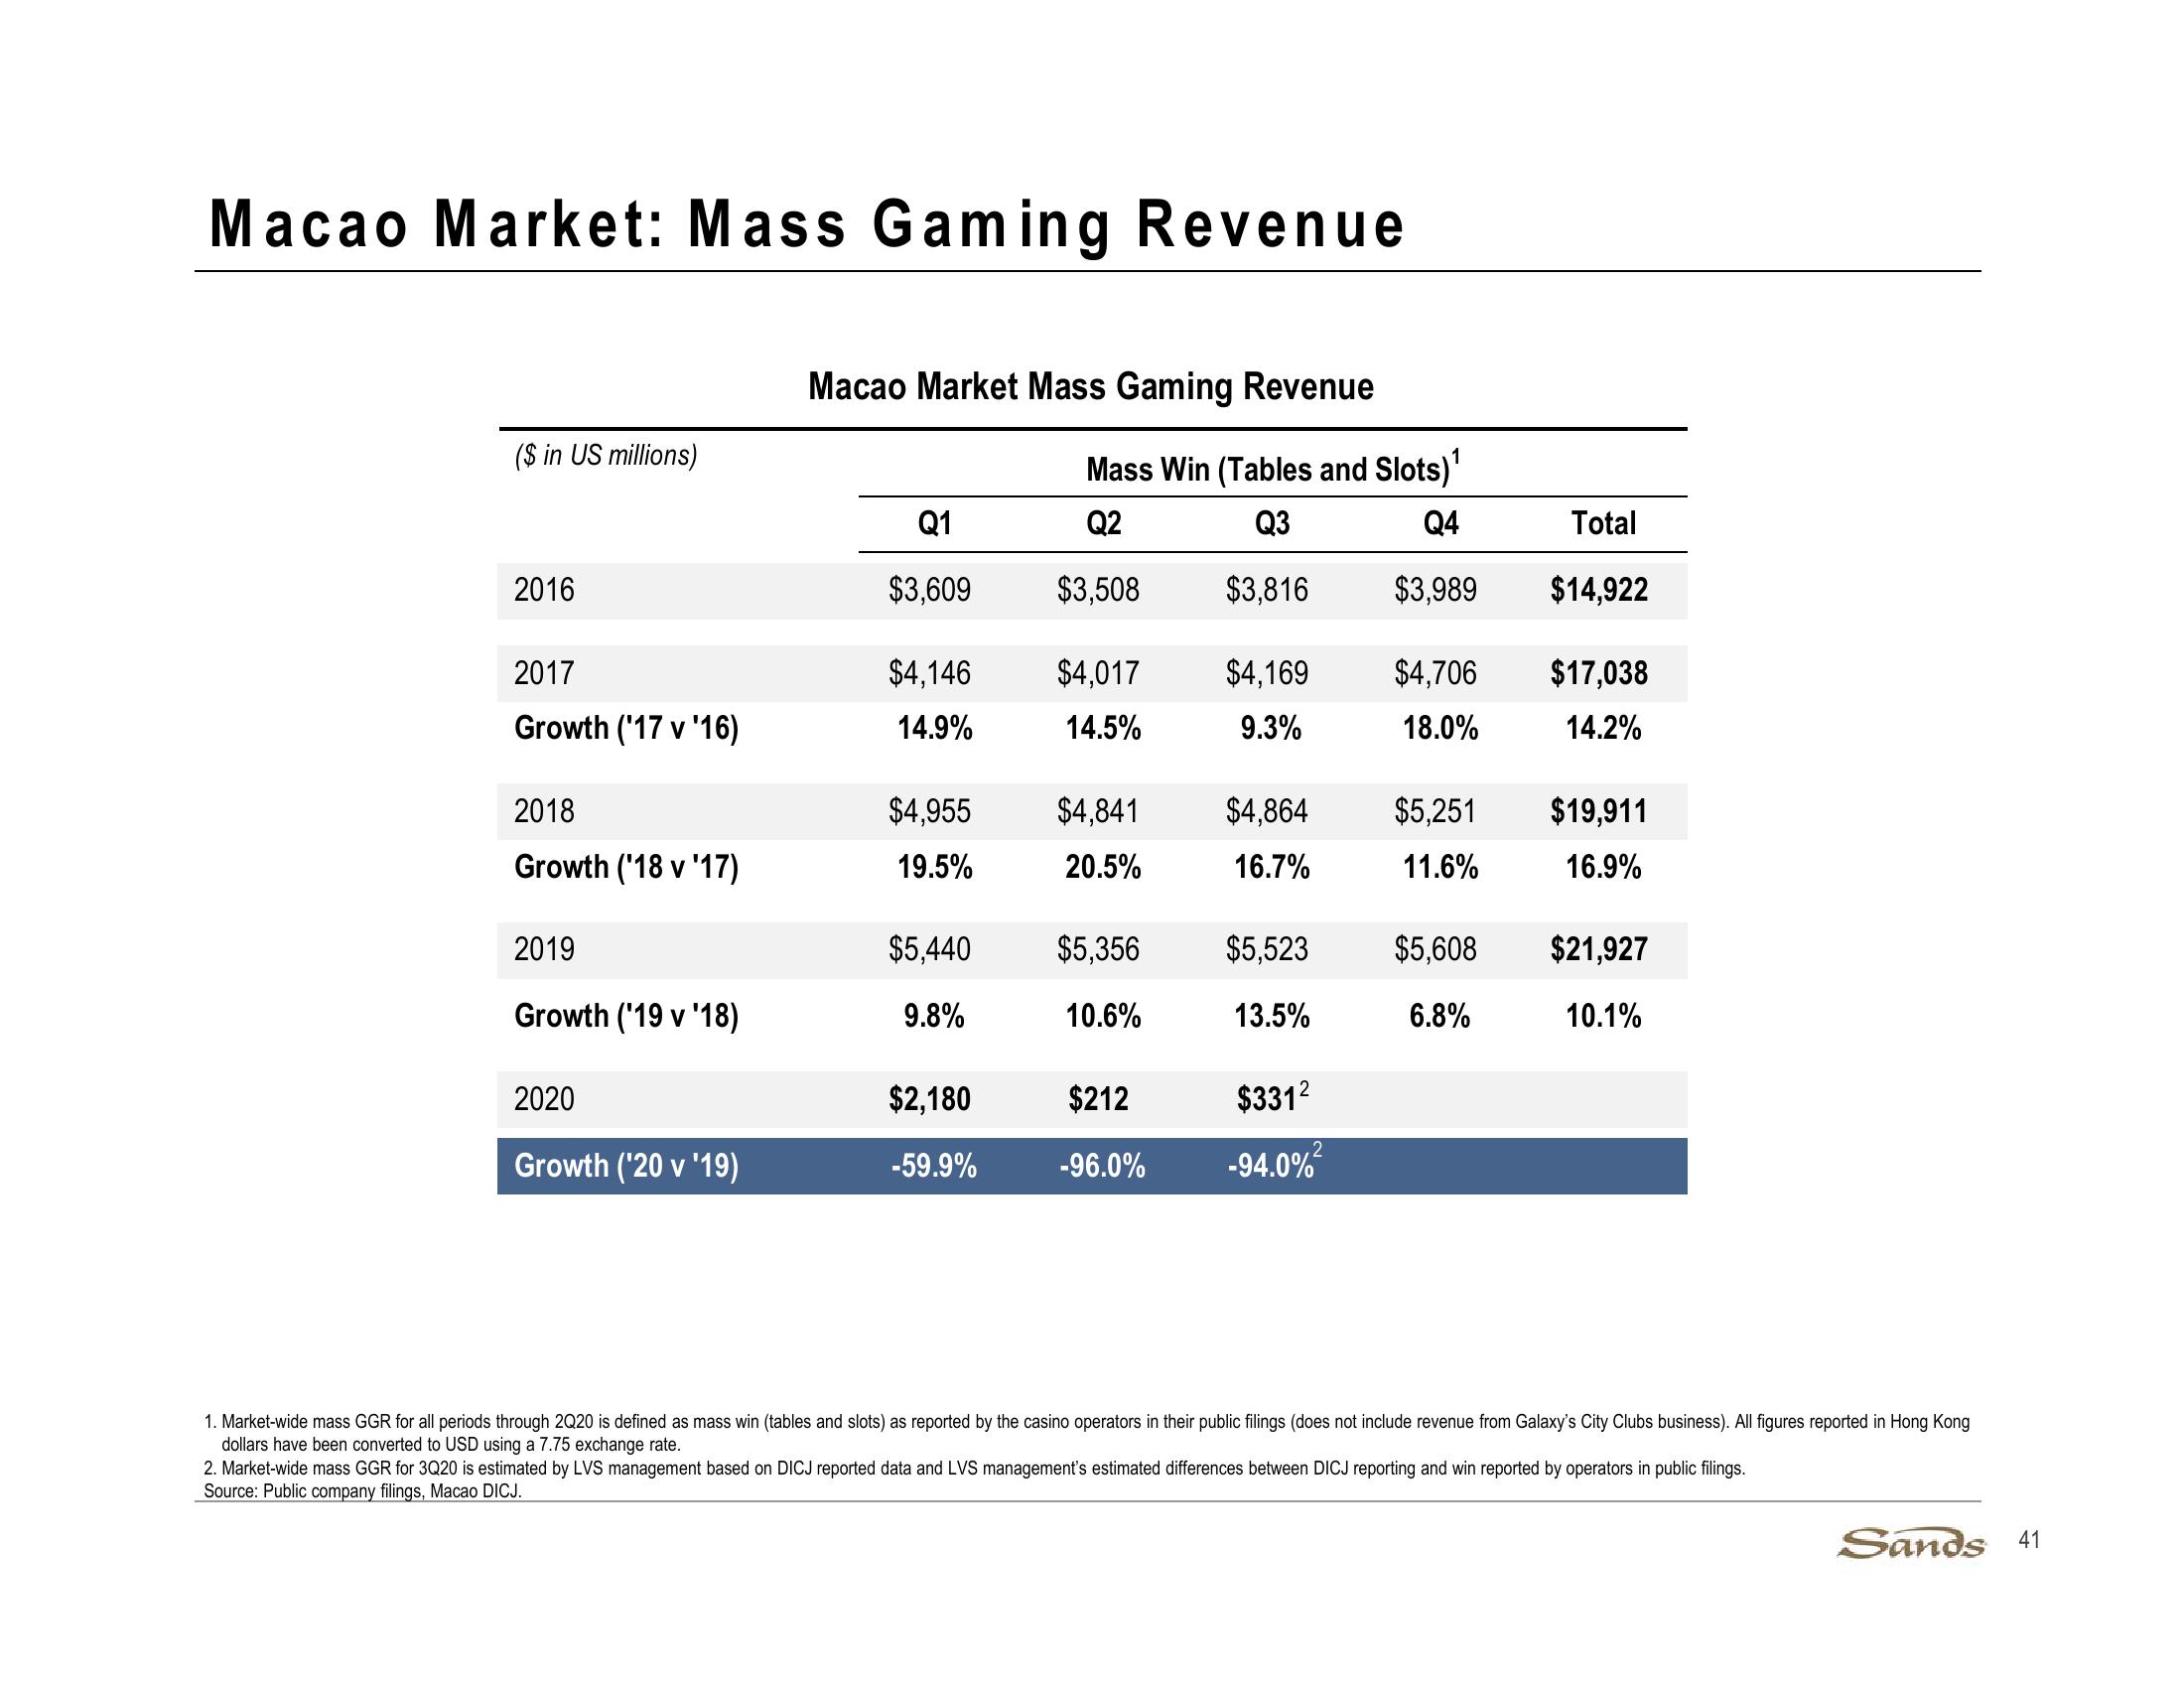
Macao Market: Mass Gaming Revenue
Macao Market Mass Gaming Revenue
($ in US millions)
Mass Win (Tables and Slots)¹
Q1
Q2
Q3
Q4
Total
2016
$3,609
$3,508
$3,816
$3,989
$14,922
2017
$4,146
$4,017
$4,169
$4,706
$17,038
Growth ('17 v '16)
14.9%
14.5%
9.3%
18.0%
14.2%
2018
$4,955
$4,841
$4,864
$5,251
$19,911
Growth ('18 v '17)
19.5%
20.5%
16.7%
11.6%
16.9%
2019
$5,440
$5,356
$5,523
$5,608
$21,927
Growth ('19 v '18)
9.8%
10.6%
13.5%
6.8%
10.1%
2020
$2,180
$212
$3312
Growth ('20 v '19)
-59.9%
-96.0%
-94.0%2
1. Market-wide mass GGR for all periods through 2Q20 is defined as mass win (tables and slots) as reported by the casino operators in their public filings (does not include revenue from Galaxy's City Clubs business). All figures reported in Hong Kong
dollars have been converted to USD using a 7.75 exchange rate.
2. Market-wide mass GGR for 3Q20 is estimated by LVS management based on DICJ reported data and LVS management's estimated differences between DICJ reporting and win reported by operators in public filings.
Source: Public company filings, Macao DICJ.
Sands 41View entire presentation