OpenText Investor Day Presentation Deck
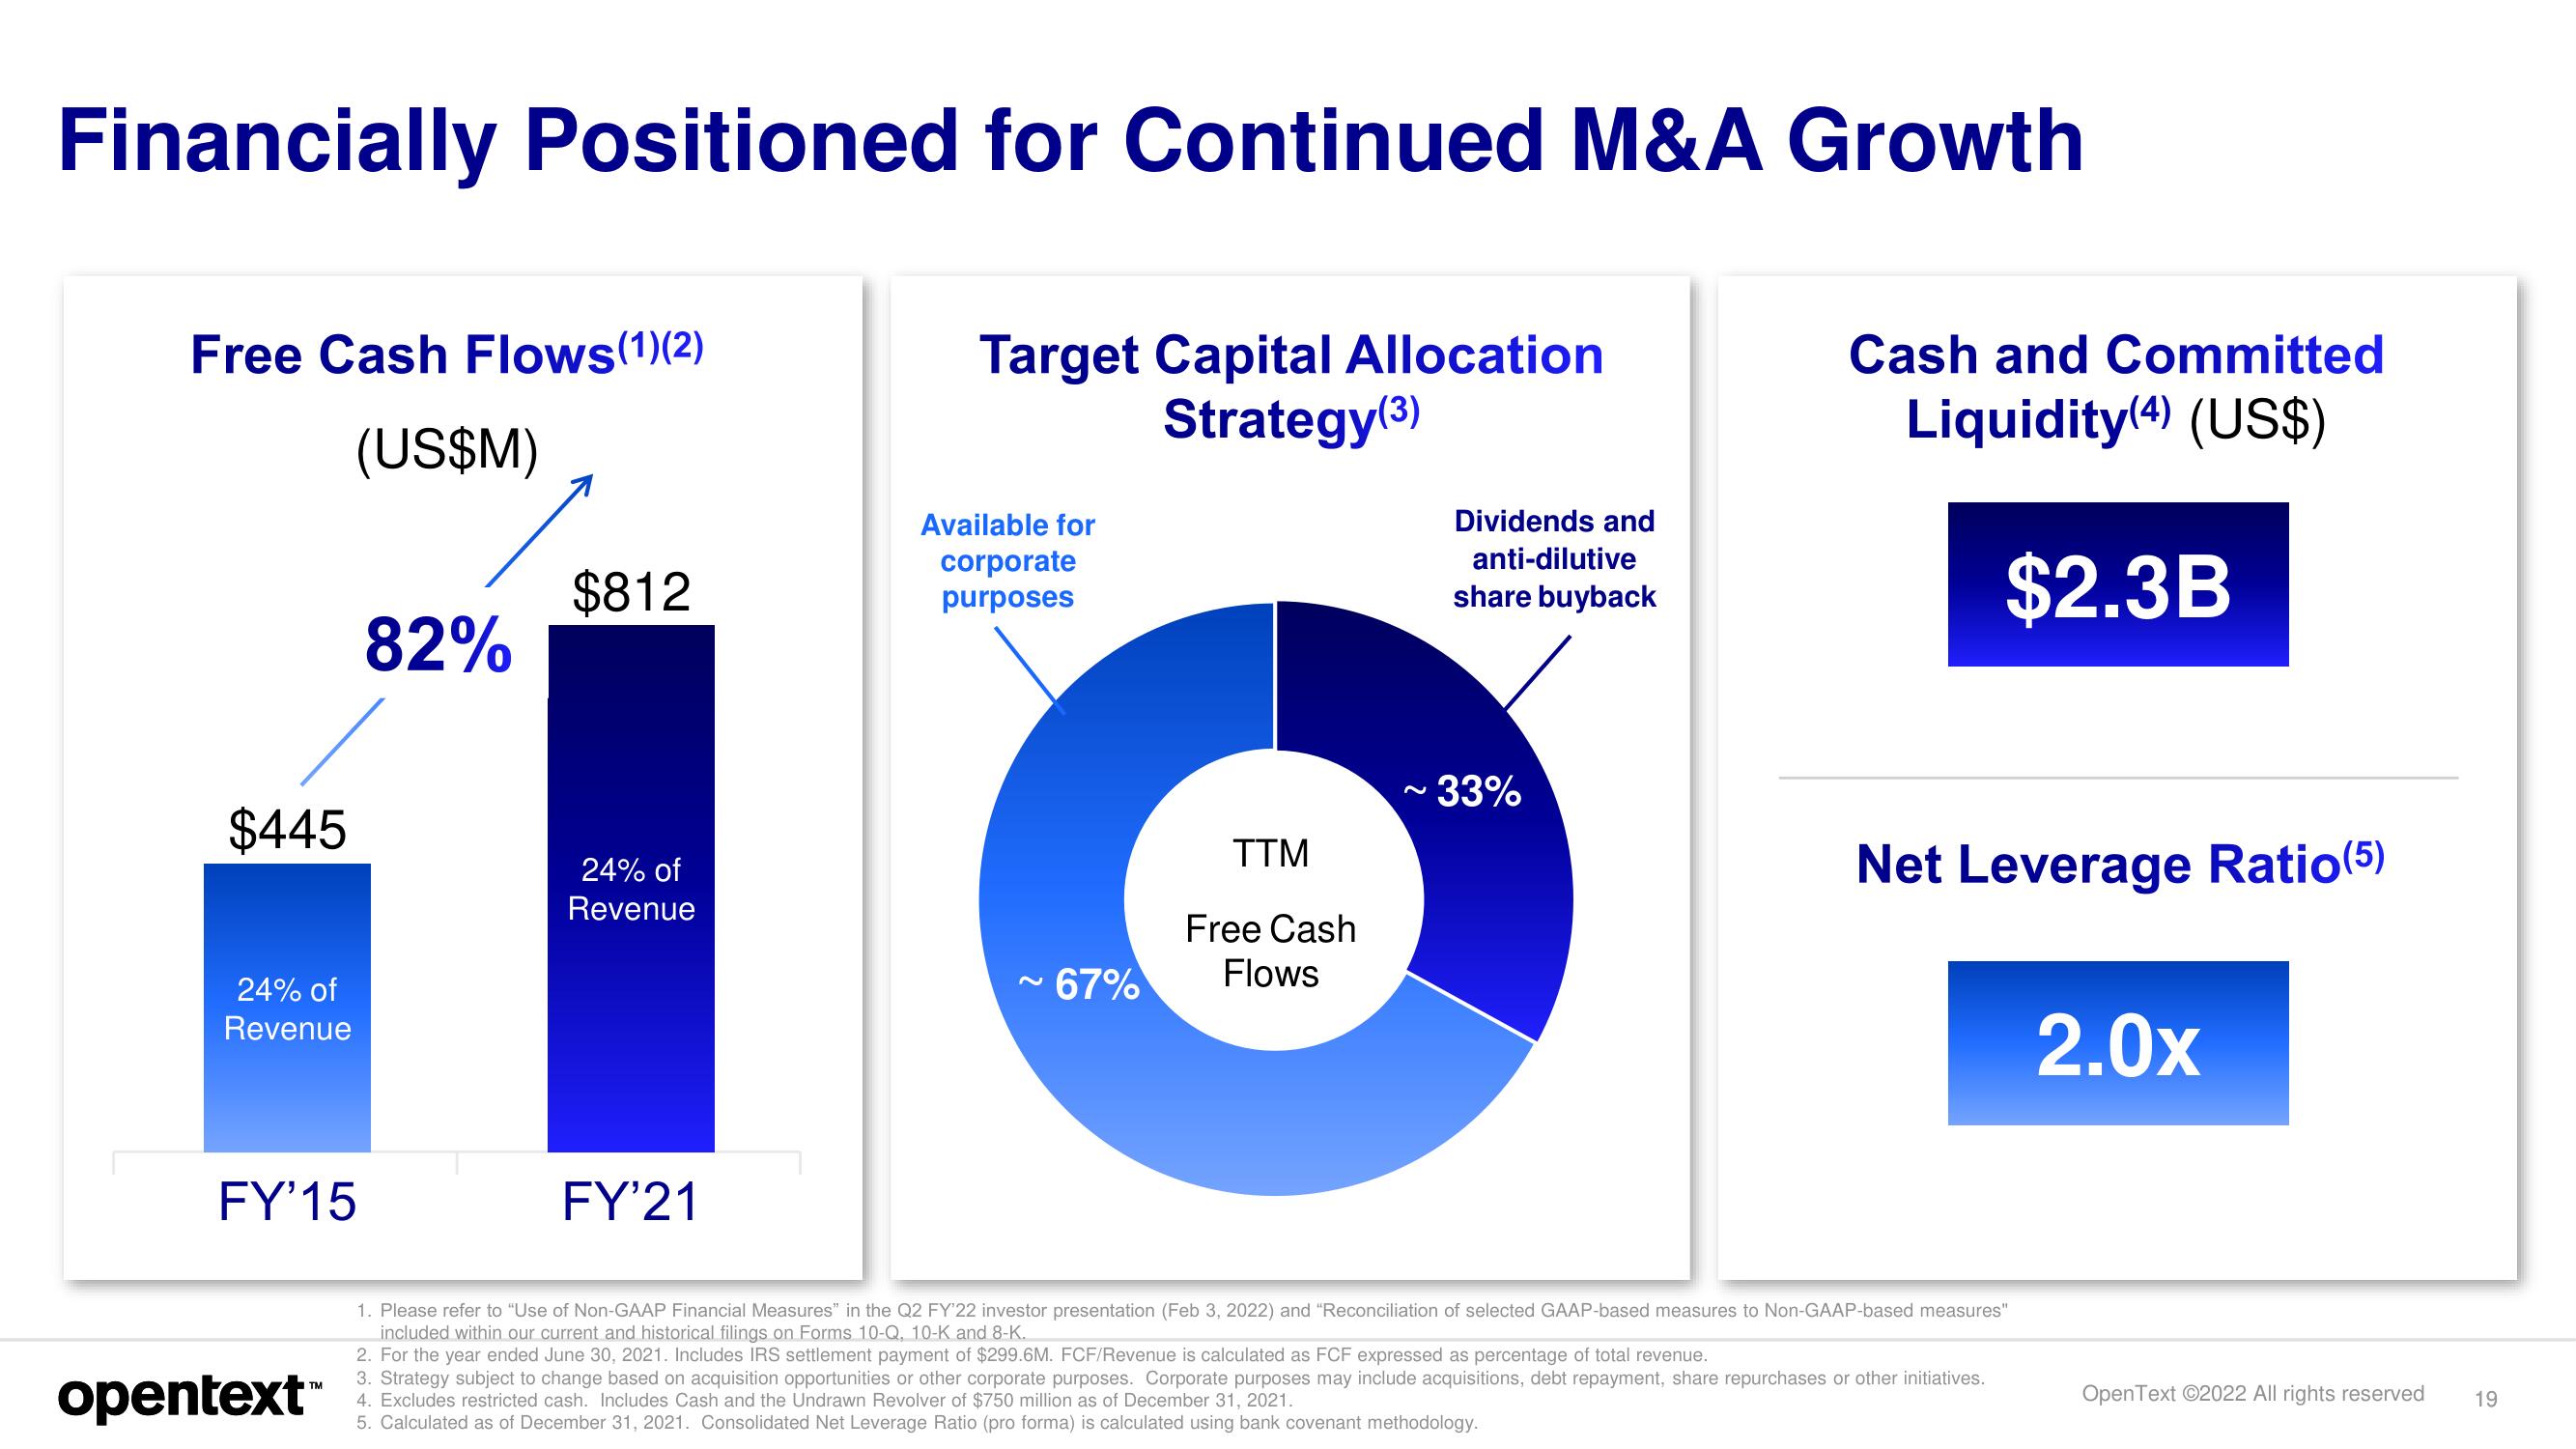
Financially Positioned for Continued M&A Growth
Target Capital Allocation
Strategy (3)
Free Cash Flows(1)(2)
(US$M)
$445
24% of
Revenue
FY'15
opentext™
82%
$812
24% of
Revenue
FY'21
Available for
corporate
purposes
~ 67%
TTM
Free Cash
Flows
Dividends and
anti-dilutive
share buyback
~ 33%
Cash and Committed
Liquidity (4) (US$)
$2.3B
Net Leverage Ratio (5)
1. Please refer to "Use of Non-GAAP Financial Measures" in the Q2 FY'22 investor presentation (Feb 3, 2022) and "Reconciliation of selected GAAP-based measures to Non-GAAP-based measures"
included within our current and historical filings on Forms 10-Q, 10-K and 8-K.
2. For the year ended June 30, 2021. Includes IRS settlement payment of $299.6M. FCF/Revenue is calculated as FCF expressed as percentage of total revenue.
3. Strategy subject to change based on acquisition opportunities or other corporate purposes. Corporate purposes may include acquisitions, debt repayment, share repurchases or other initiatives.
4. Excludes restricted cash. Includes Cash and the Undrawn Revolver of $750 million as of December 31, 2021.
5. Calculated as of December 31, 2021. Consolidated Net Leverage Ratio (pro forma) is calculated using bank covenant methodology.
2.0x
OpenText Ⓒ2022 All rights reserved
19View entire presentation