Deutsche Telekom Investor Day Presentation Deck
(UNAUDITED)
This presentation includes non-GAAP financial measures. The non-GAAP financial measures should be considered in addition to, but not as a substitute for, the information provided in accordance with
GAAP. Reconciliations for the non-GAAP financial measures to the most directly comparable GAAP financial measures are provided below. T-Mobile is not able to forecast Net income on a forward-looking
basis without unreasonable efforts due to the high variability and difficulty in predicting certain items that affect GAAP net income including, but not limited to, Income tax expense, stock-based
compensation expense and Interest expense. Adjusted EBITDA and Core Adjusted EBITDA should not be used to predict Net income as the difference between those measures and Net income is variable.
T-MOBILE US, INC.
RECONCILIATION OF NON-GAAP FINANCIAL MEASURES TO GAAP FINANCIAL MEASURES
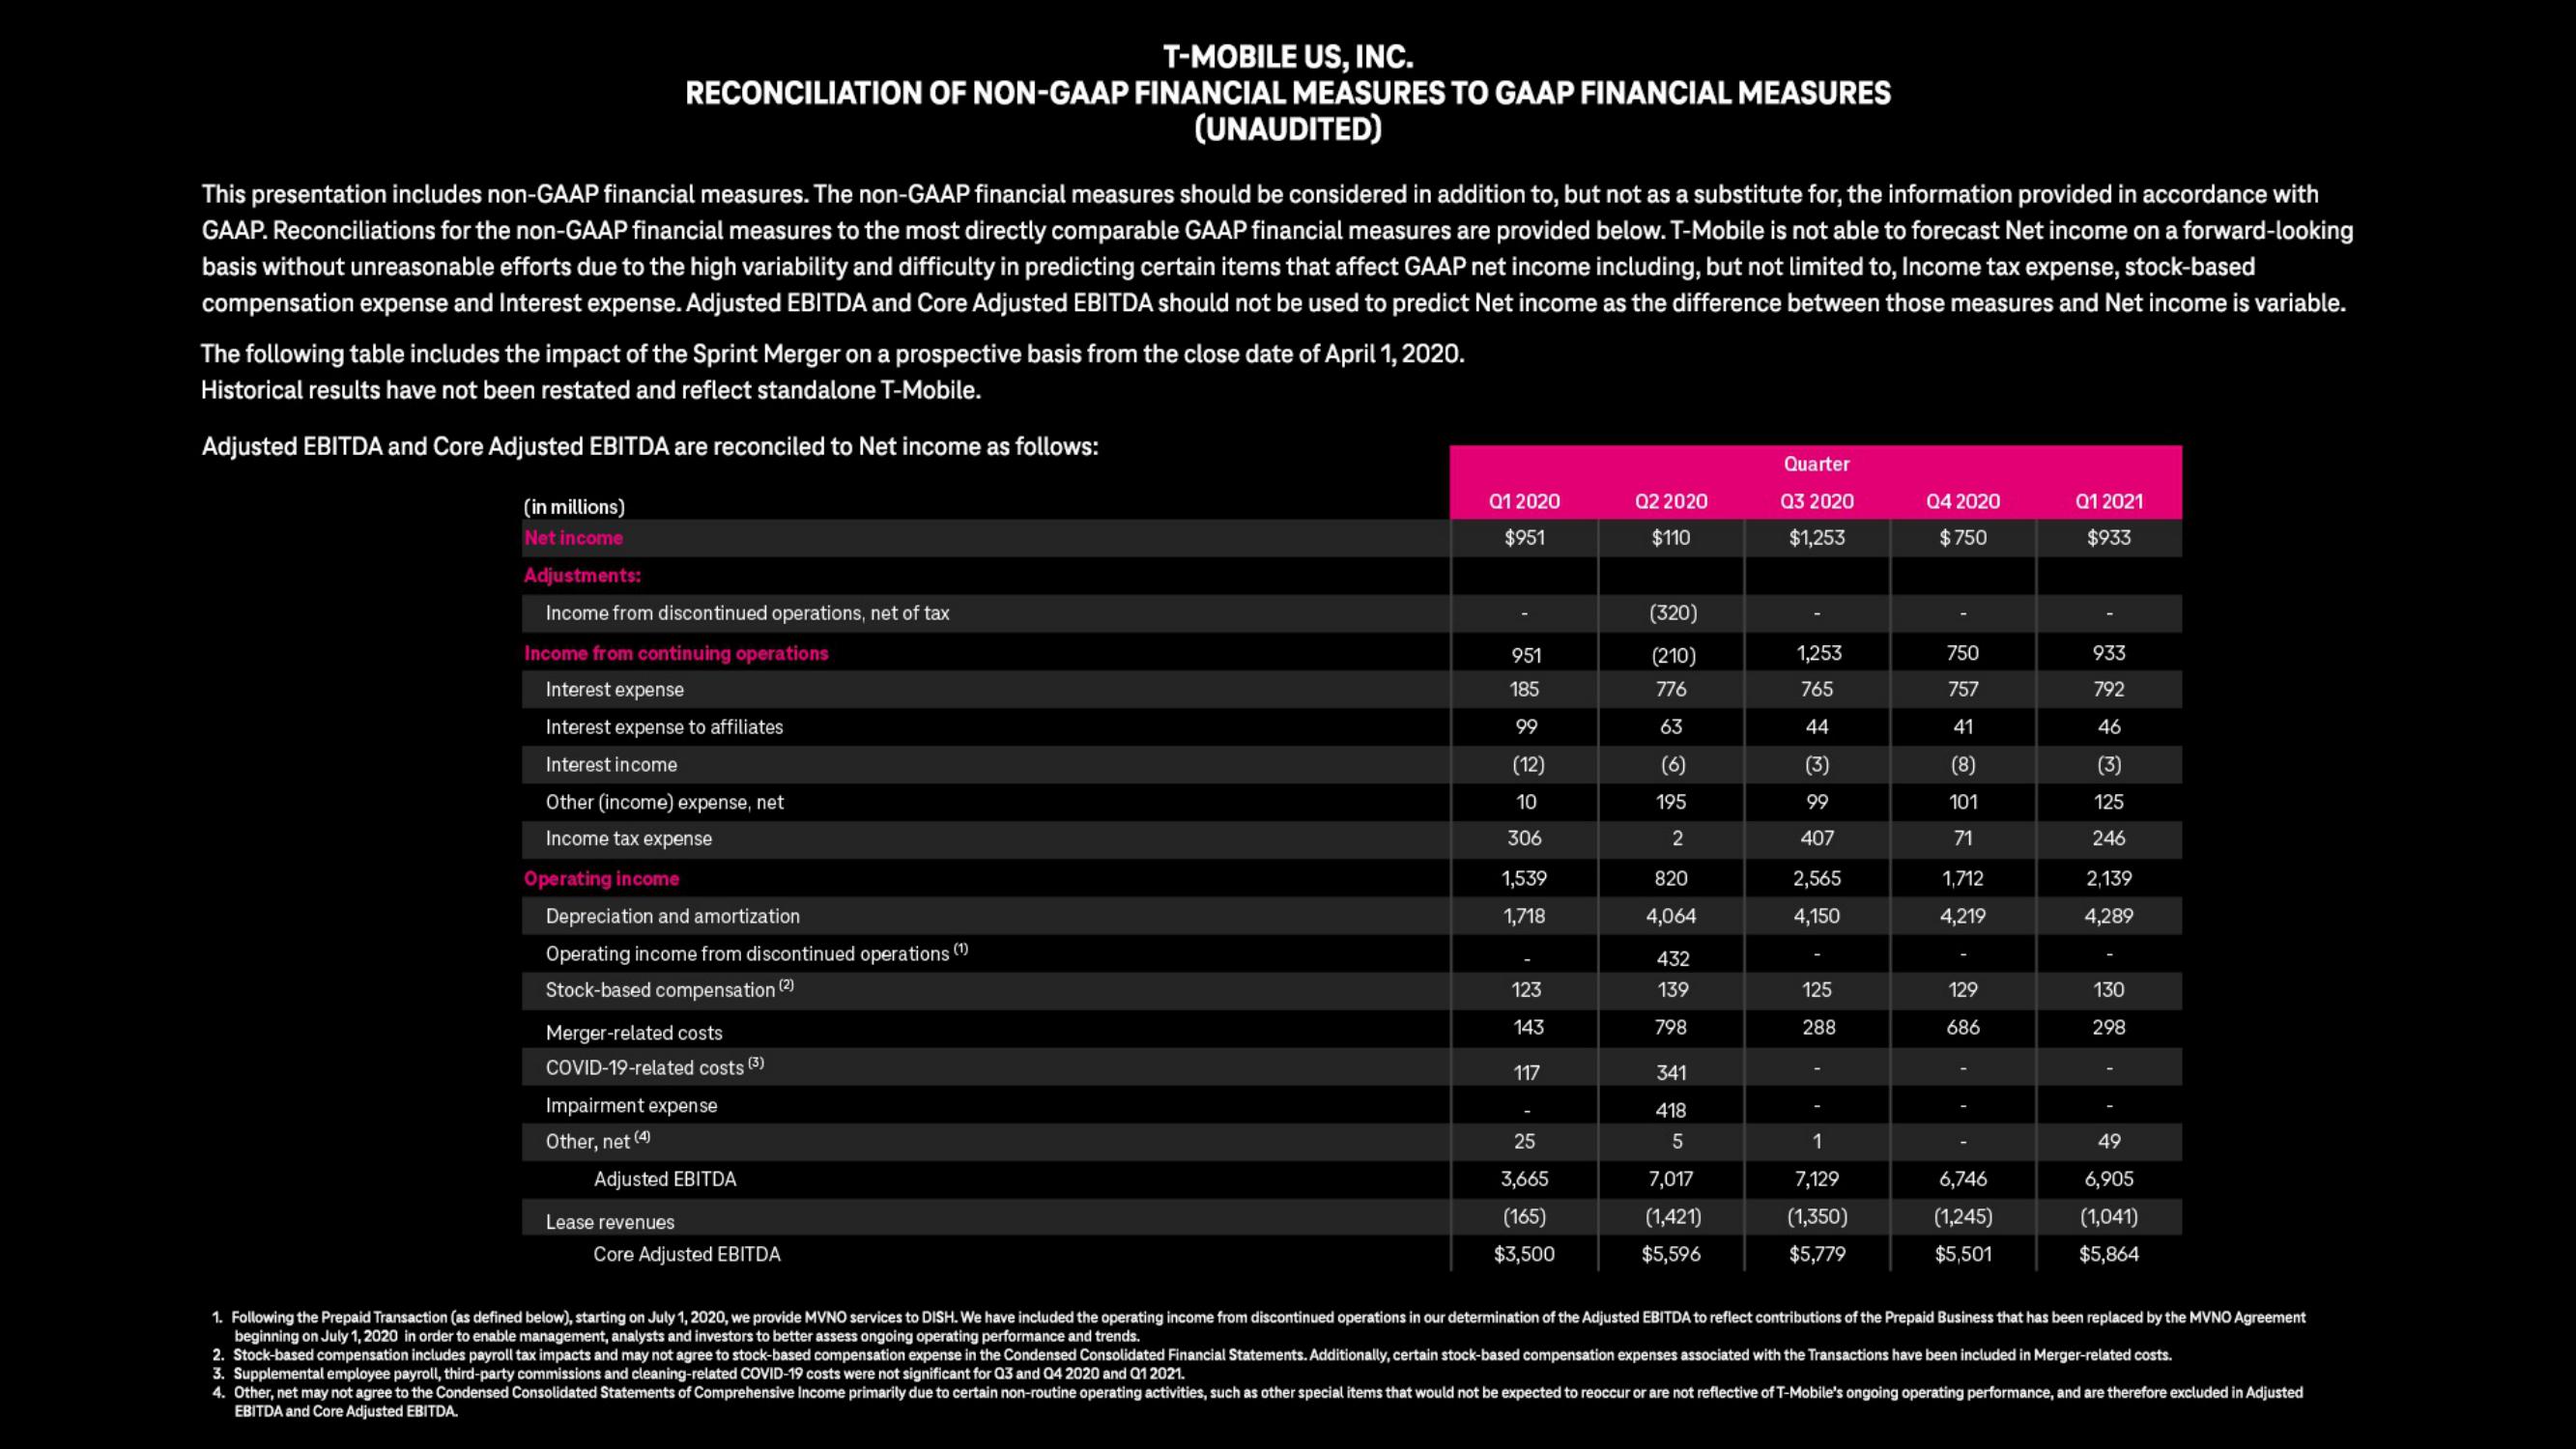
The following table includes the impact of the Sprint Merger on a prospective basis from the close date of April 1, 2020.
Historical results have not been restated and reflect standalone T-Mobile.
Adjusted EBITDA and Core Adjusted EBITDA are reconciled to Net income as follows:
(in millions)
Net income
Adjustments:
Income from discontinued operations, net of tax
Income from continuing operations
Interest expense
Interest expense to affiliates
Interest income
Other (income) expense, net
Income tax expense
Operating income
Depreciation and amortization
Operating income from discontinued operations (1)
Stock-based compensation (2)
Merger-related costs
COVID-19-related costs (3)
Impairment expense
Other, net (4)
Adjusted EBITDA
Lease revenues
Core Adjusted EBITDA
Q1 2020
$951
951
185
99
(12)
10
306
1,539
1,718
123
143
117
25
3,665
(165)
$3,500
Q2 2020
$110
(320)
(210)
776
63
(6)
195
2
820
4,064
432
139
798
341
418
5
7,017
(1,421)
$5,596
Quarter
Q3 2020
$1,253
1,253
765
44
(3)
99
407
2,565
4,150
125
288
1
7,129
(1,350)
$5,779
Q4 2020
$750
750
757
41
(8)
101
71
1,712
4,219
129
686
6,746
(1,245)
$5,501
Q1 2021
$933
933
792
46
(3)
125
246
2,139
4,289
130
298
49
6,905
(1,041)
$5,864
1. Following the Prepaid Transaction (as defined below), starting on July 1, 2020, we provide MVNO services to DISH. We have included the operating income from discontinued operations in our determination of the Adjusted EBITDA to reflect contributions of the Prepaid Business that has been replaced by the MVNO Agreement
beginning on July 1, 2020 in order to enable management, analysts and investors to better assess ongoing operating performance and trends.
2. Stock-based compensation includes payroll tax impacts and may not agree to stock-based compensation expense in the Condensed Consolidated Financial Statements. Additionally, certain stock-based compensation expenses associated with the Transactions have been included in Merger-related costs.
3. Supplemental employee payroll, third-party commissions and cleaning-related COVID-19 costs were not significant for Q3 and Q4 2020 and Q1 2021.
4. Other, net may not agree to the Condensed Consolidated Statements of Comprehensive Income primarily due to certain non-routine operating activities, such as other special items that would not be expected to reoccur or are not reflective of T-Mobile's ongoing operating performance, and are therefore excluded in Adjusted
EBITDA and Core Adjusted EBITDA.View entire presentation