BlackSky SPAC Presentation Deck
($ in millions)
FY ending 12/31
Imagery
Data, Software & Analytics
Engineering & Integration
Revenue
% growth
(-) Cost of Goods Sold
Gross profit
% margin
(-) Opex
(-) Other Operating Expense and Adjustments
Operating profit
% margin
(+) D&A
(+) Adjustments
Adj. EBITDA
% margin
(-) Capex
2
Free Cash Flow (FCF) ²
3
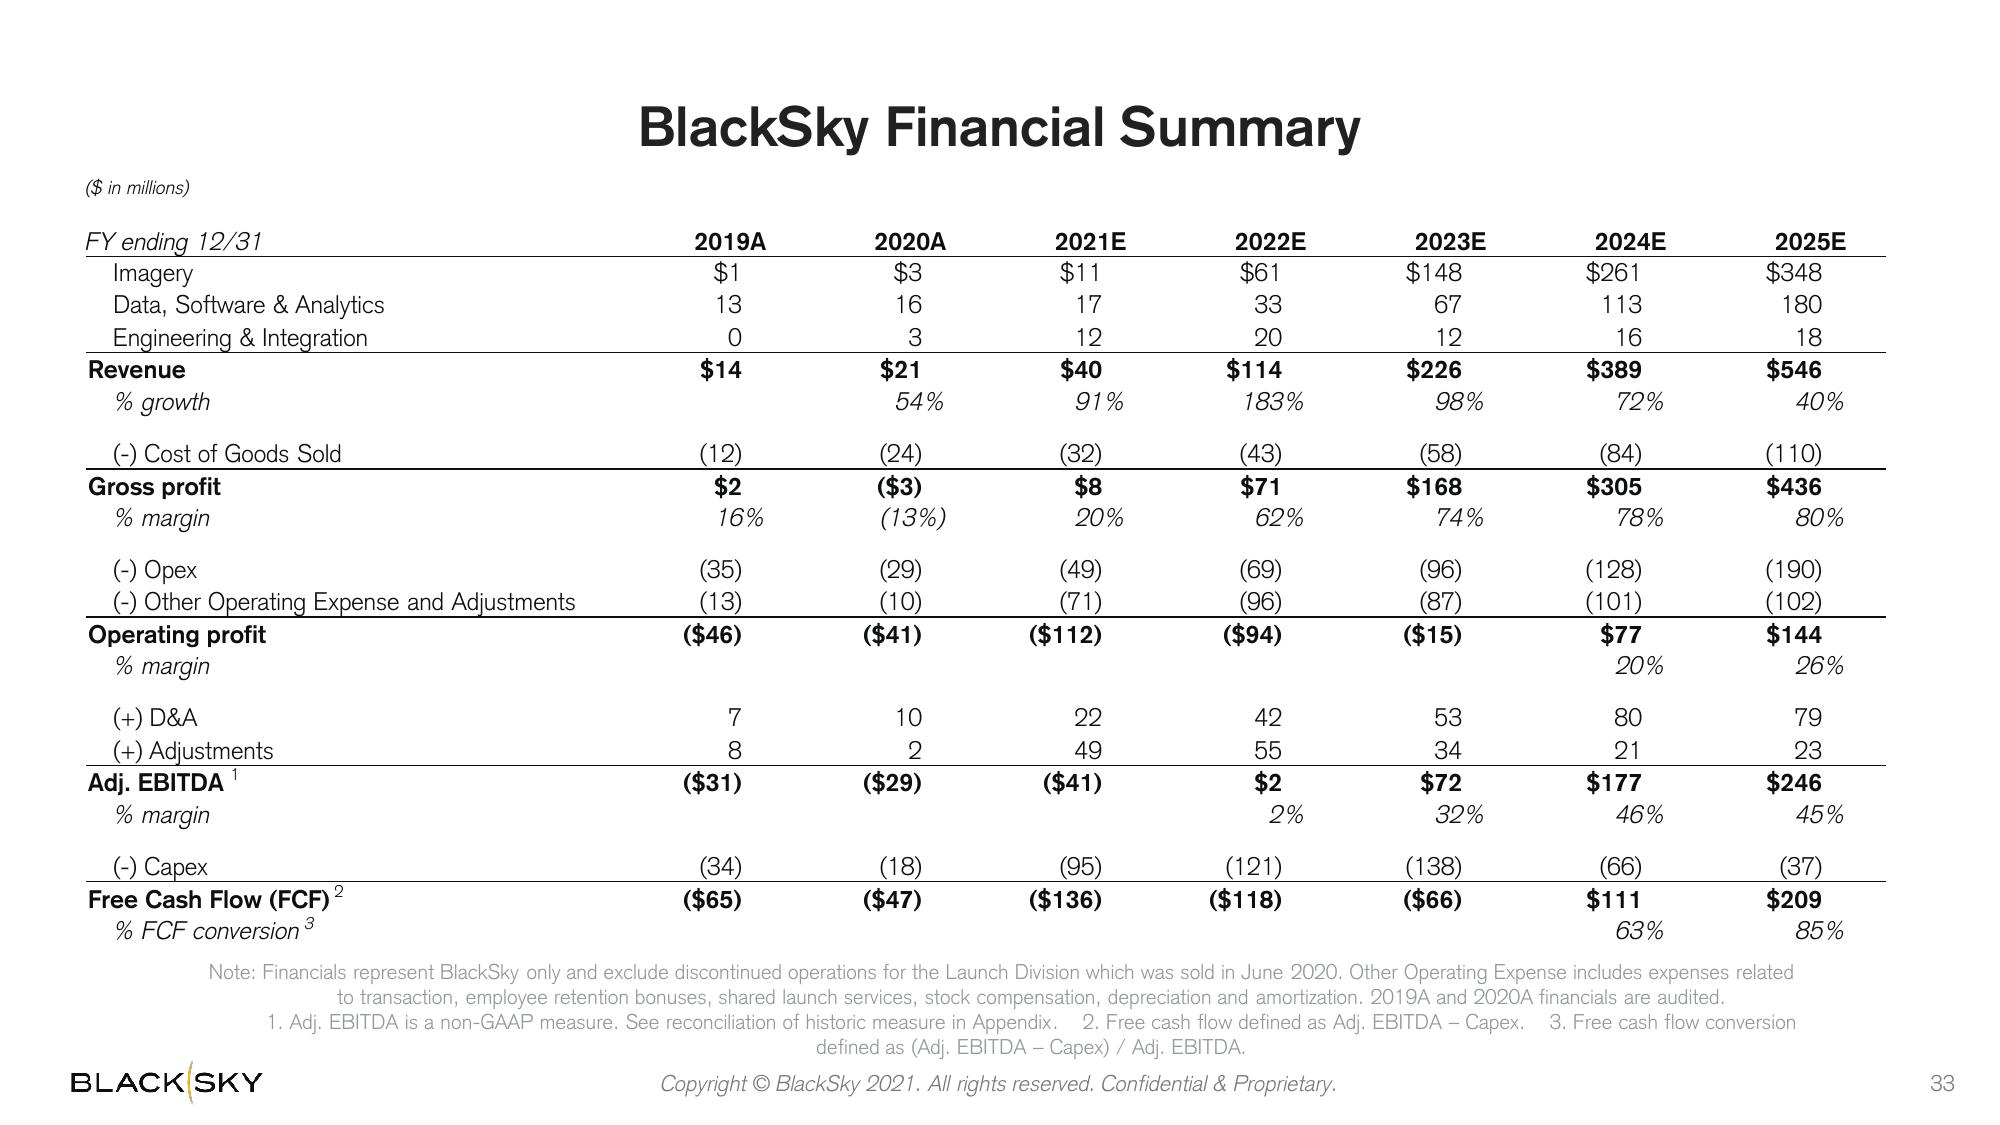
BlackSky Financial Summary
BLACK SKY
2019A
$1
13
0
$14
(12)
$2
16%
(35)
(13)
($46)
7
8
($31)
(34)
($65)
2020A
$3
16
3
$21
54%
(24)
($3)
(13%)
(29)
(10)
($41)
10
2
($29)
(18)
($47)
2021E
$11
17
12
$40
91%
(32)
$8
20%
(49)
(71)
($112)
22
49
($41)
(95)
($136)
2022E
$61
33
20
$114
183%
(43)
$71
62%
(69)
(96)
($94)
42
55
$2
2%
(121)
($118)
2023E
$148
67
12
$226
98%
(58)
$168
74%
(96)
(87)
($15)
53
34
$72
32%
(138)
($66)
2024E
$261
113
16
$389
72%
(84)
$305
78%
(128)
(101)
$77
20%
80
21
$177
46%
(66)
$111
2025E
63%
$348
180
18
$546
40%
(110)
$436
80%
(190)
(102)
$144
26%
79
23
$246
45%
% FCF conversion
Note: Financials represent BlackSky only and exclude discontinued operations for the Launch Division which was sold in June 2020. Other Operating Expense includes expenses related
to transaction, employee retention bonuses, shared launch services, stock compensation, depreciation and amortization. 2019A and 2020A financials are audited.
1. Adj. EBITDA is a non-GAAP measure. See reconciliation of historic measure in Appendix. 2. Free cash flow defined as Adj. EBITDA - Capex. 3. Free cash flow conversion
defined as (Adj. EBITDA - Capex) / Adj. EBITDA.
Copyright © BlackSky 2021. All rights reserved. Confidential & Proprietary.
(37)
$209
85%
33View entire presentation