Codere SPAC Presentation Deck
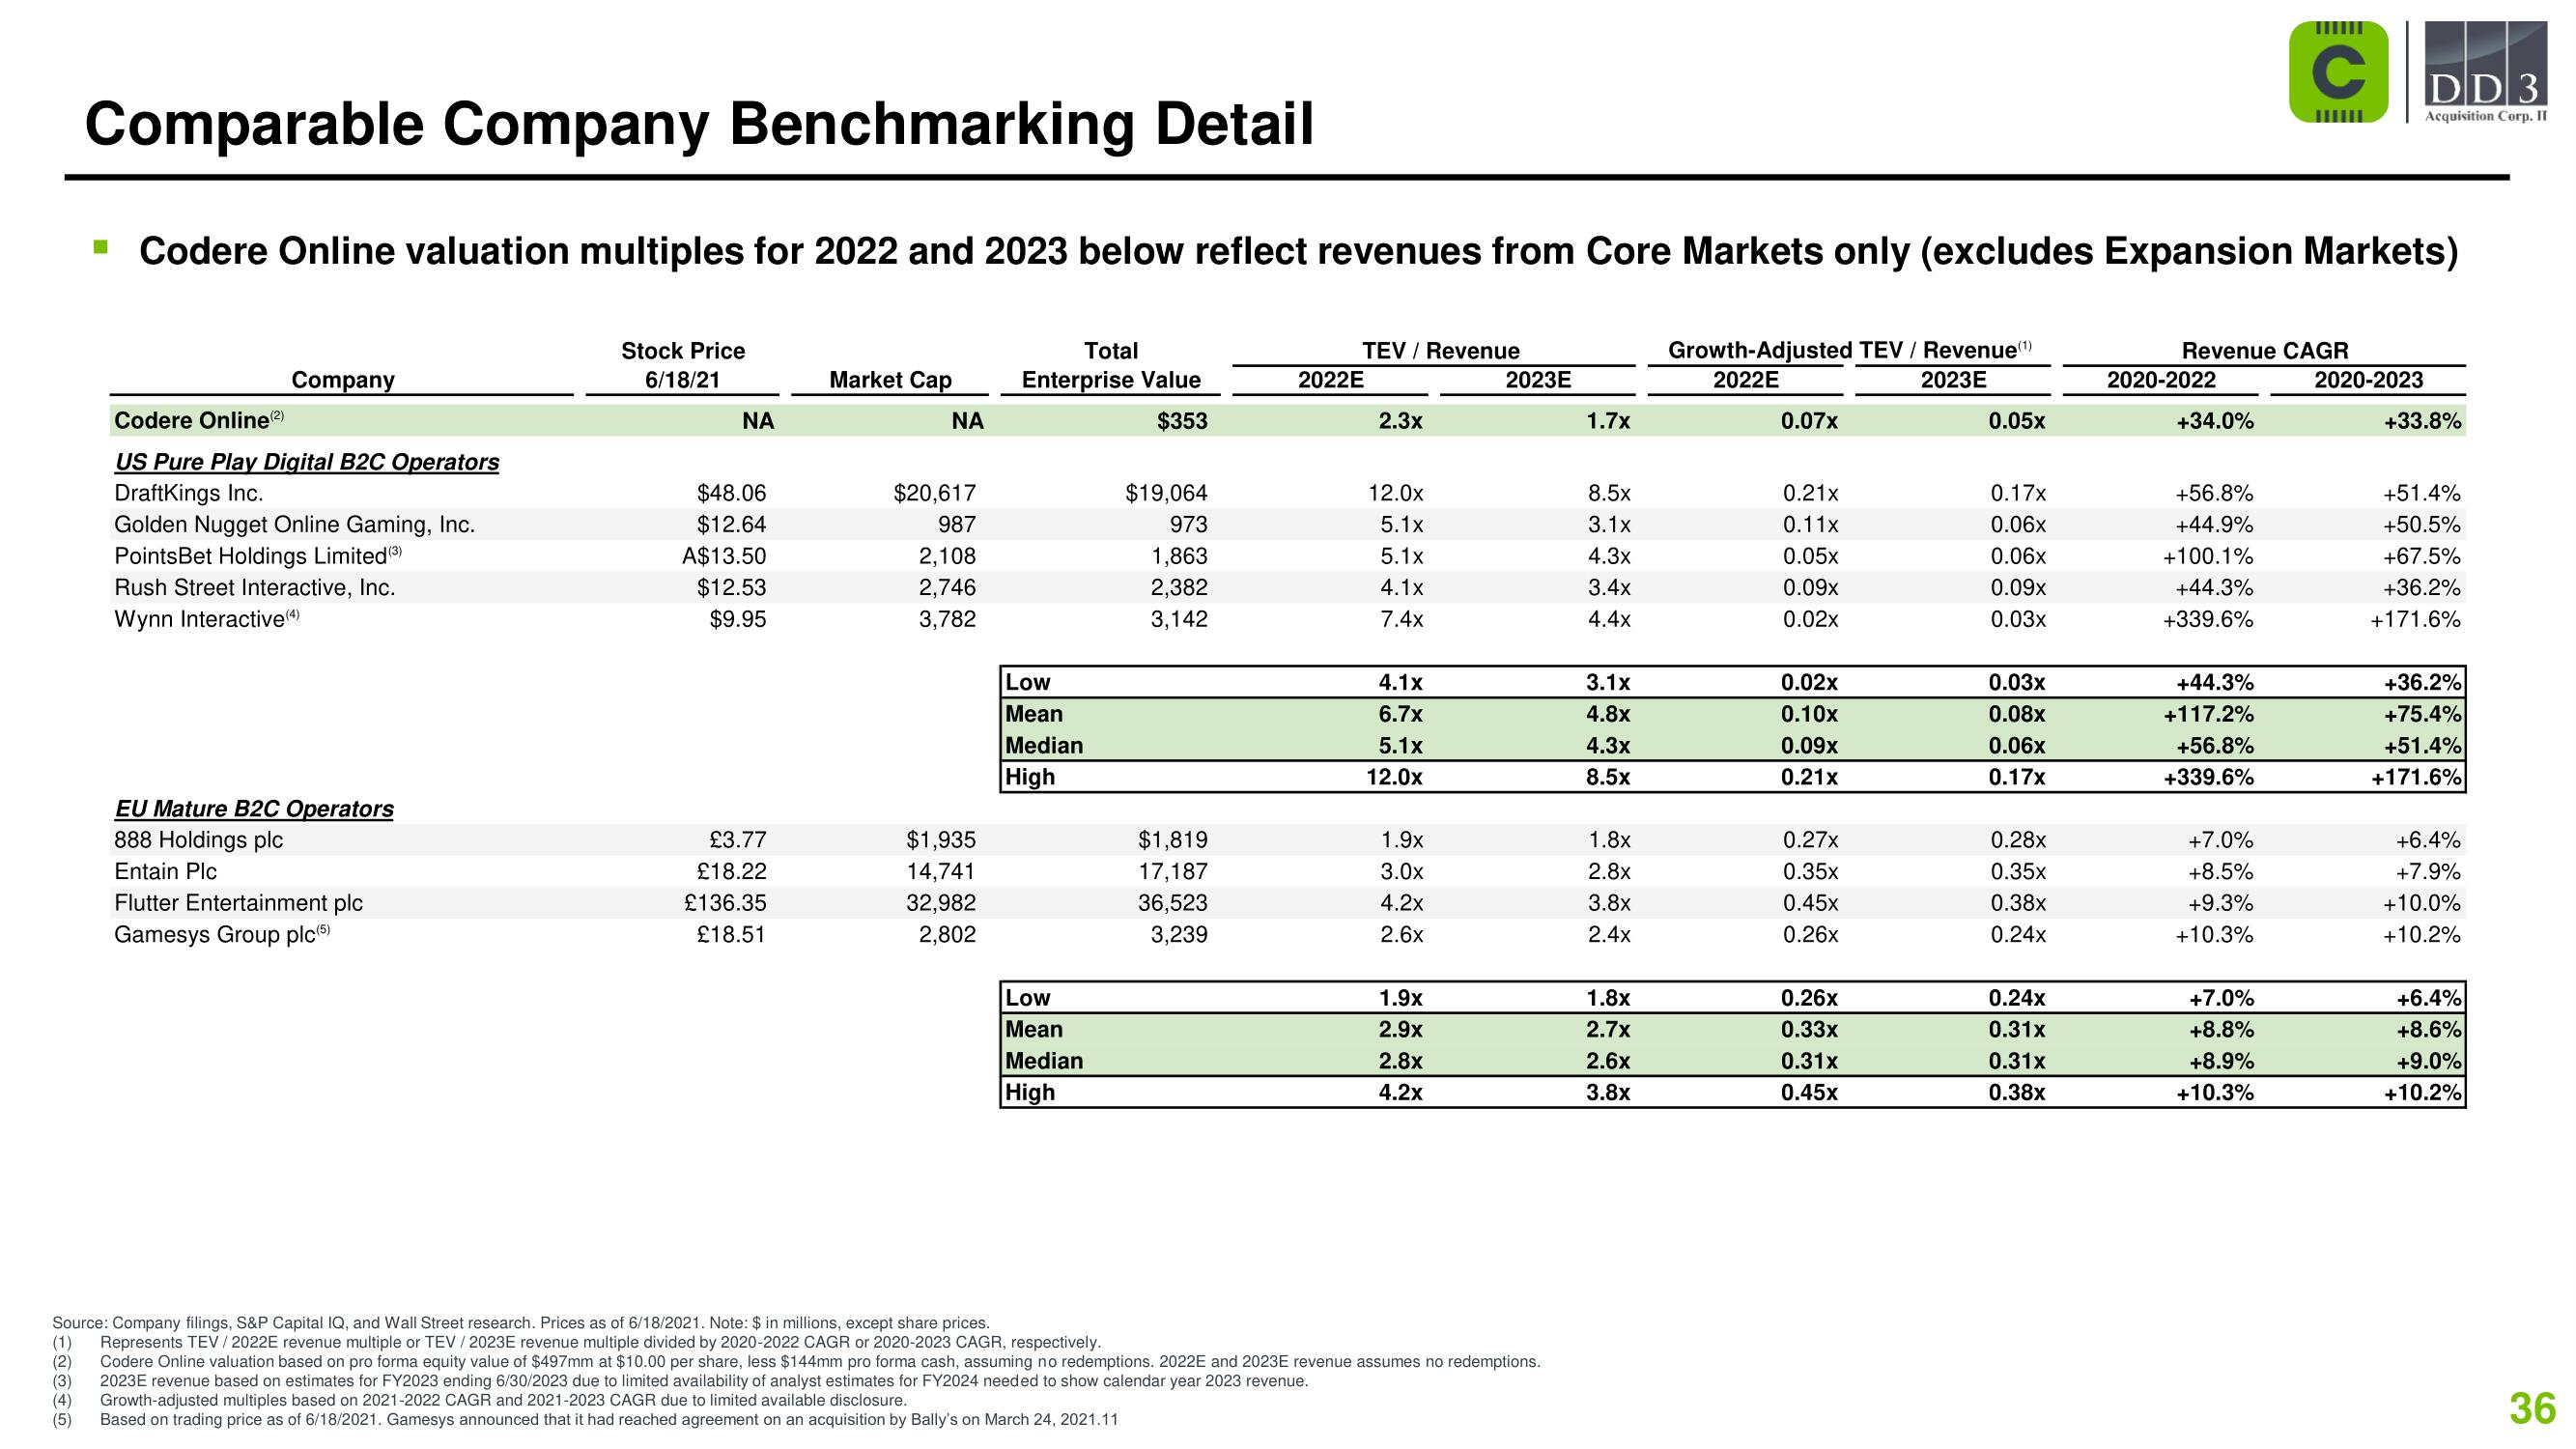
Comparable Company Benchmarking Detail
(3)
(4)
(5)
Company
Codere Online valuation multiples for 2022 and 2023 below reflect revenues from Core Markets only (excludes Expansion Markets)
Stock Price
6/18/21
Total
Enterprise Value
$353
Growth-Adjusted TEV / Revenue (¹)
2022E
2023E
Codere Online (²)
US Pure Play Digital B2C Operators
DraftKings Inc.
Golden Nugget Online Gaming, Inc.
PointsBet Holdings Limited (³)
Rush Street Interactive, Inc.
Wynn Interactive (4)
EU Mature B2C Operators
888 Holdings plc
Entain Plc
Flutter Entertainment plc
Gamesys Group plc (5)
ΝΑ
$48.06
$12.64
A$13.50
$12.53
$9.95
£3.77
£18.22
£136.35
£18.51
Market Cap
ΝΑ
$20,617
987
2,108
2,746
3,782
$1,935
14,741
32,982
2,802
Low
Mean
Median
High
Low
Mean
Median
High
$19,064
973
1,863
2,382
3,142
$1,819
17,187
36,523
3,239
TEV / Revenue
2022E
2.3x
12.0x
5.1x
5.1x
4.1x
7.4x
4.1x
6.7x
5.1x
12.0x
1.9x
3.0x
4.2x
2.6x
1.9x
2.9x
2.8x
4.2x
2023E
Source: Company filings, S&P Capital IQ, and Wall Street research. Prices as of 6/18/2021. Note: $ in millions, except share prices.
(1) Represents TEV /2022E revenue multiple or TEV / 2023E revenue multiple divided by 2020-2022 CAGR or 2020-2023 CAGR, respectively.
(2)
Codere Online valuation based on pro forma equity value of $497mm at $10.00 per share, less $144mm pro forma cash, assuming no redemptions. 2022E and 2023E revenue assumes no redemptions.
2023E revenue based on estimates for FY2023 ending 6/30/2023 due to limited availability of analyst estimates for FY2024 needed to show calendar year 2023 revenue.
Growth-adjusted multiples based on 2021-2022 CAGR and 2021-2023 CAGR due to limited available disclosure.
Based on trading price as of 6/18/2021. Gamesys announced that it had reached agreement on an acquisition by Bally's on March 24, 2021.11
1.7x
8.5x
3.1x
4.3x
3.4x
4.4x
3.1x
4.8x
4.3x
8.5x
1.8x
2.8x
3.8x
2.4x
1.8x
2.7x
2.6x
3.8x
0.07x
0.21x
0.11x
0.05x
0.09x
0.02x
0.02x
0.10x
0.09x
0.21x
0.27x
0.35x
0.45x
0.26x
0.26x
0.33x
0.31x
0.45x
0.05x
0.17x
0.06x
0.06x
0.09x
0.03x
0.03x
0.08x
0.06x
0.17x
0.28x
0.35x
0.38x
0.24x
0.24x
0.31x
0.31x
0.38x
Revenue CAGR
2020-2022
+34.0%
+56.8%
+44.9%
+100.1%
+44.3%
+339.6%
+44.3%
+117.2%
+56.8%
+339.6%
C
+7.0%
+8.5%
+9.3%
+10.3%
+7.0%
+8.8%
+8.9%
+10.3%
DD 3
Acquisition Corp. II
2020-2023
+33.8%
+51.4%
+50.5%
+67.5%
+36.2%
+171.6%
+36.2%
+75.4%
+51.4%
+171.6%
+6.4%
+7.9%
+10.0%
+10.2%
+6.4%
+8.6%
+9.0%
+10.2%
36View entire presentation