Tradeweb Investor Presentation Deck
Reconciliation of Non-GAAP Items (continued) ($ in thousands, except per share and share amounts)
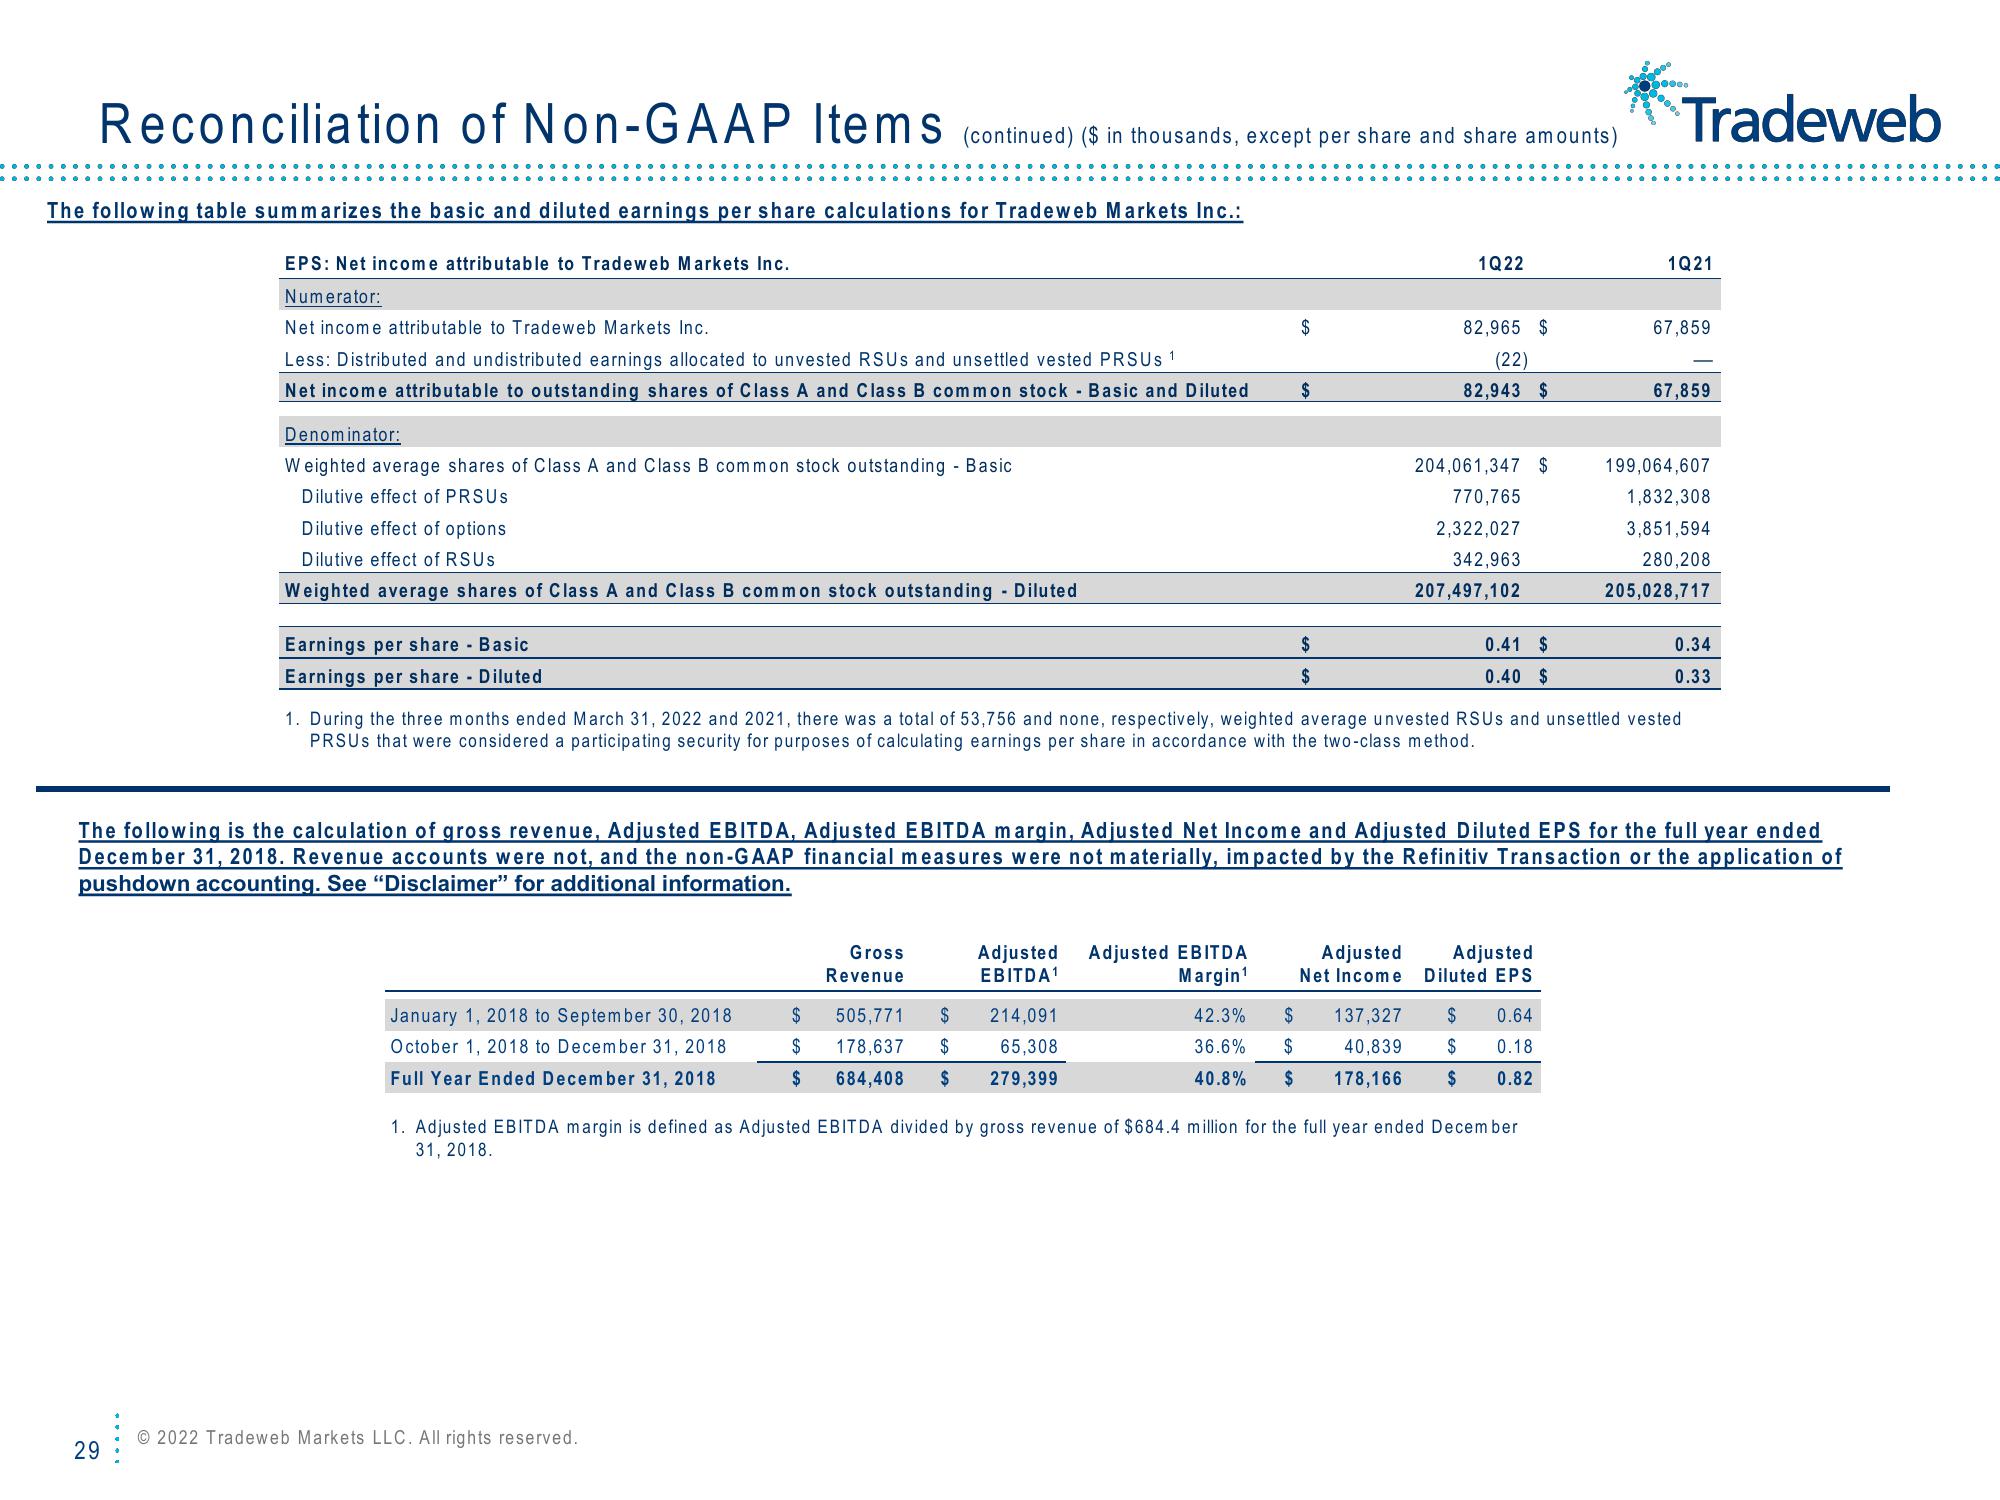
The following table summarizes the basic and diluted earnings per share calculations for Tradeweb Markets Inc.:
EPS: Net income attributable to Tradeweb Markets Inc.
Numerator:
Net income attributable to Tradeweb Markets Inc.
Less: Distributed and undistributed earnings allocated to unvested RSUS and unsettled vested PRSUS ¹
Net income attributable to outstanding shares of Class A and Class B common stock - Basic and Diluted
Denominator:
Weighted average shares of Class A and Class B common stock outstanding - Basic
Dilutive effect of PRSUS
Dilutive effect of options.
Dilutive effect of RSUS
Weighted average shares of Class A and Class B common stock outstanding - Diluted
29
Earnings per share - Basic
Earnings per share - Diluted
January 1, 2018 to September 30, 2018
October 1, 2018 to December 31, 2018
Full Year Ended December 31, 2018
$
$
$
© 2022 Tradeweb Markets LLC. All rights reserved.
$
Gross
Revenue
505,771 $
178,637 $
684,408 $
$
$
$
214,091
65,308
279,399
1Q22
82,965 $
(22)
82,943 $
204,061,347 $
770,765
2,322,027
342,963
207,497,102
0.41 $
0.40 $
1. During the three months ended March 31, 2022 and 2021, there was a total of 53,756 and none, respectively, weighted average unvested RSUS and unsettled vested
PRSUS that were considered a participating security for purposes of calculating earnings per share in accordance with the two-class method.
Adjusted Adjusted EBITDA
EBITDA ¹
Margin¹
42.3% $ 137,327 $ 0.64
36.6% $ 40,839 $ 0.18
40.8% $ 178,166 $ 0.82
The following is the calculation of gross revenue, Adjusted EBITDA, Adjusted EBITDA margin, Adjusted Net Income and Adjusted Diluted EPS for the full year ended
December 31, 2018. Revenue accounts were not, and the non-GAAP financial measures were not materially, impacted by the Refinitiv Transaction or the application of
pushdown accounting. See "Disclaimer" for additional information.
hooo.
Adjusted Adjusted
Net Income Diluted EPS
1. Adjusted EBITDA margin is defined as Adjusted EBITDA divided by gross revenue of $684.4 million for the full year ended December
31, 2018.
Tradeweb
1Q21
67,859
67,859
199,064,607
1,832,308
3,851,594
280,208
205,028,717
0.34
0.33View entire presentation