Pershing Square Investor Presentation Deck
Strong Performance During the Global Financial Crisis
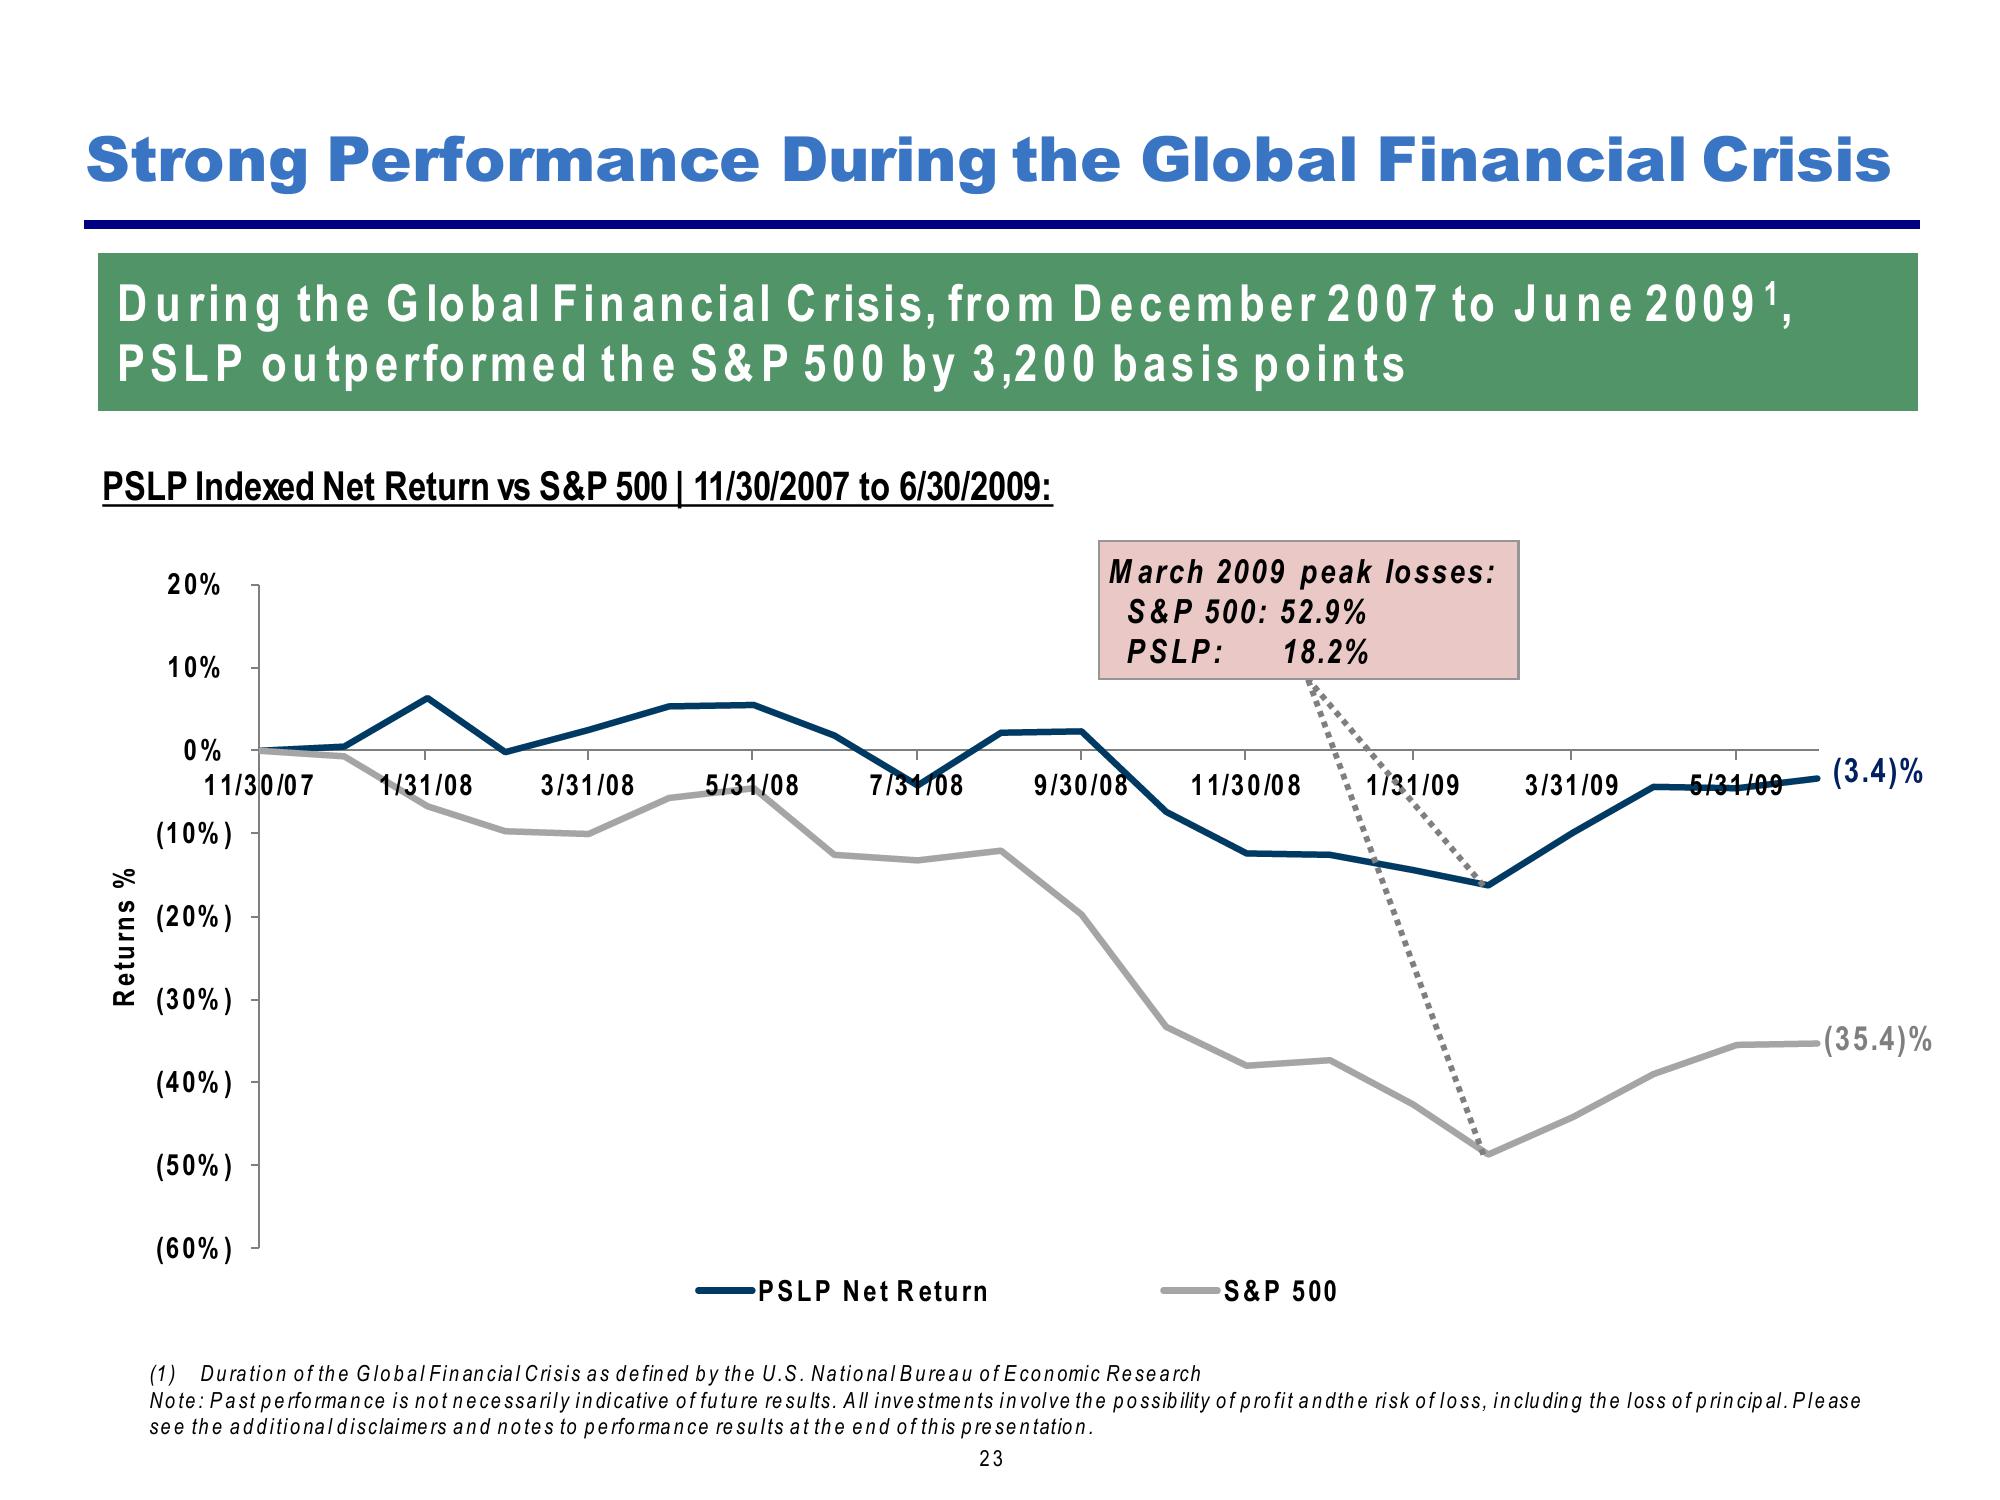
During the Global Financial Crisis, from December 2007 to June 2009¹,
PSLP outperformed the S&P 500 by 3,200 basis points
PSLP Indexed Net Return vs S&P 500 | 11/30/2007 to 6/30/2009:
Returns %
20%
10%
0%
11/30/07
(10%)
(20%)
(30%)
(40%)
(50%)
(60%)
1/31/08
3/31/08
5/31/08
7/31/08
PSLP Net Return
March 2009 peak losses:
S&P 500: 52.9%
PSLP:
18.2%
9/30/08
11/30/08
S&P 500
1/31/09
3/31/09
5/31/09
(3.4)%
-(35.4)%
(1) Duration of the Global Financial Crisis as defined by the U.S. National Bureau of Economic Research
Note: Past performance is not necessarily indicative of future results. All investments involve the possibility of profit and the risk of loss, including the loss of principal. Please
see the additional disclaimers and notes to performance results at the end of this presentation.
23View entire presentation