First Busey Results Presentation Deck
4Q23 Earnings Investor Presentation
Earnings Performance
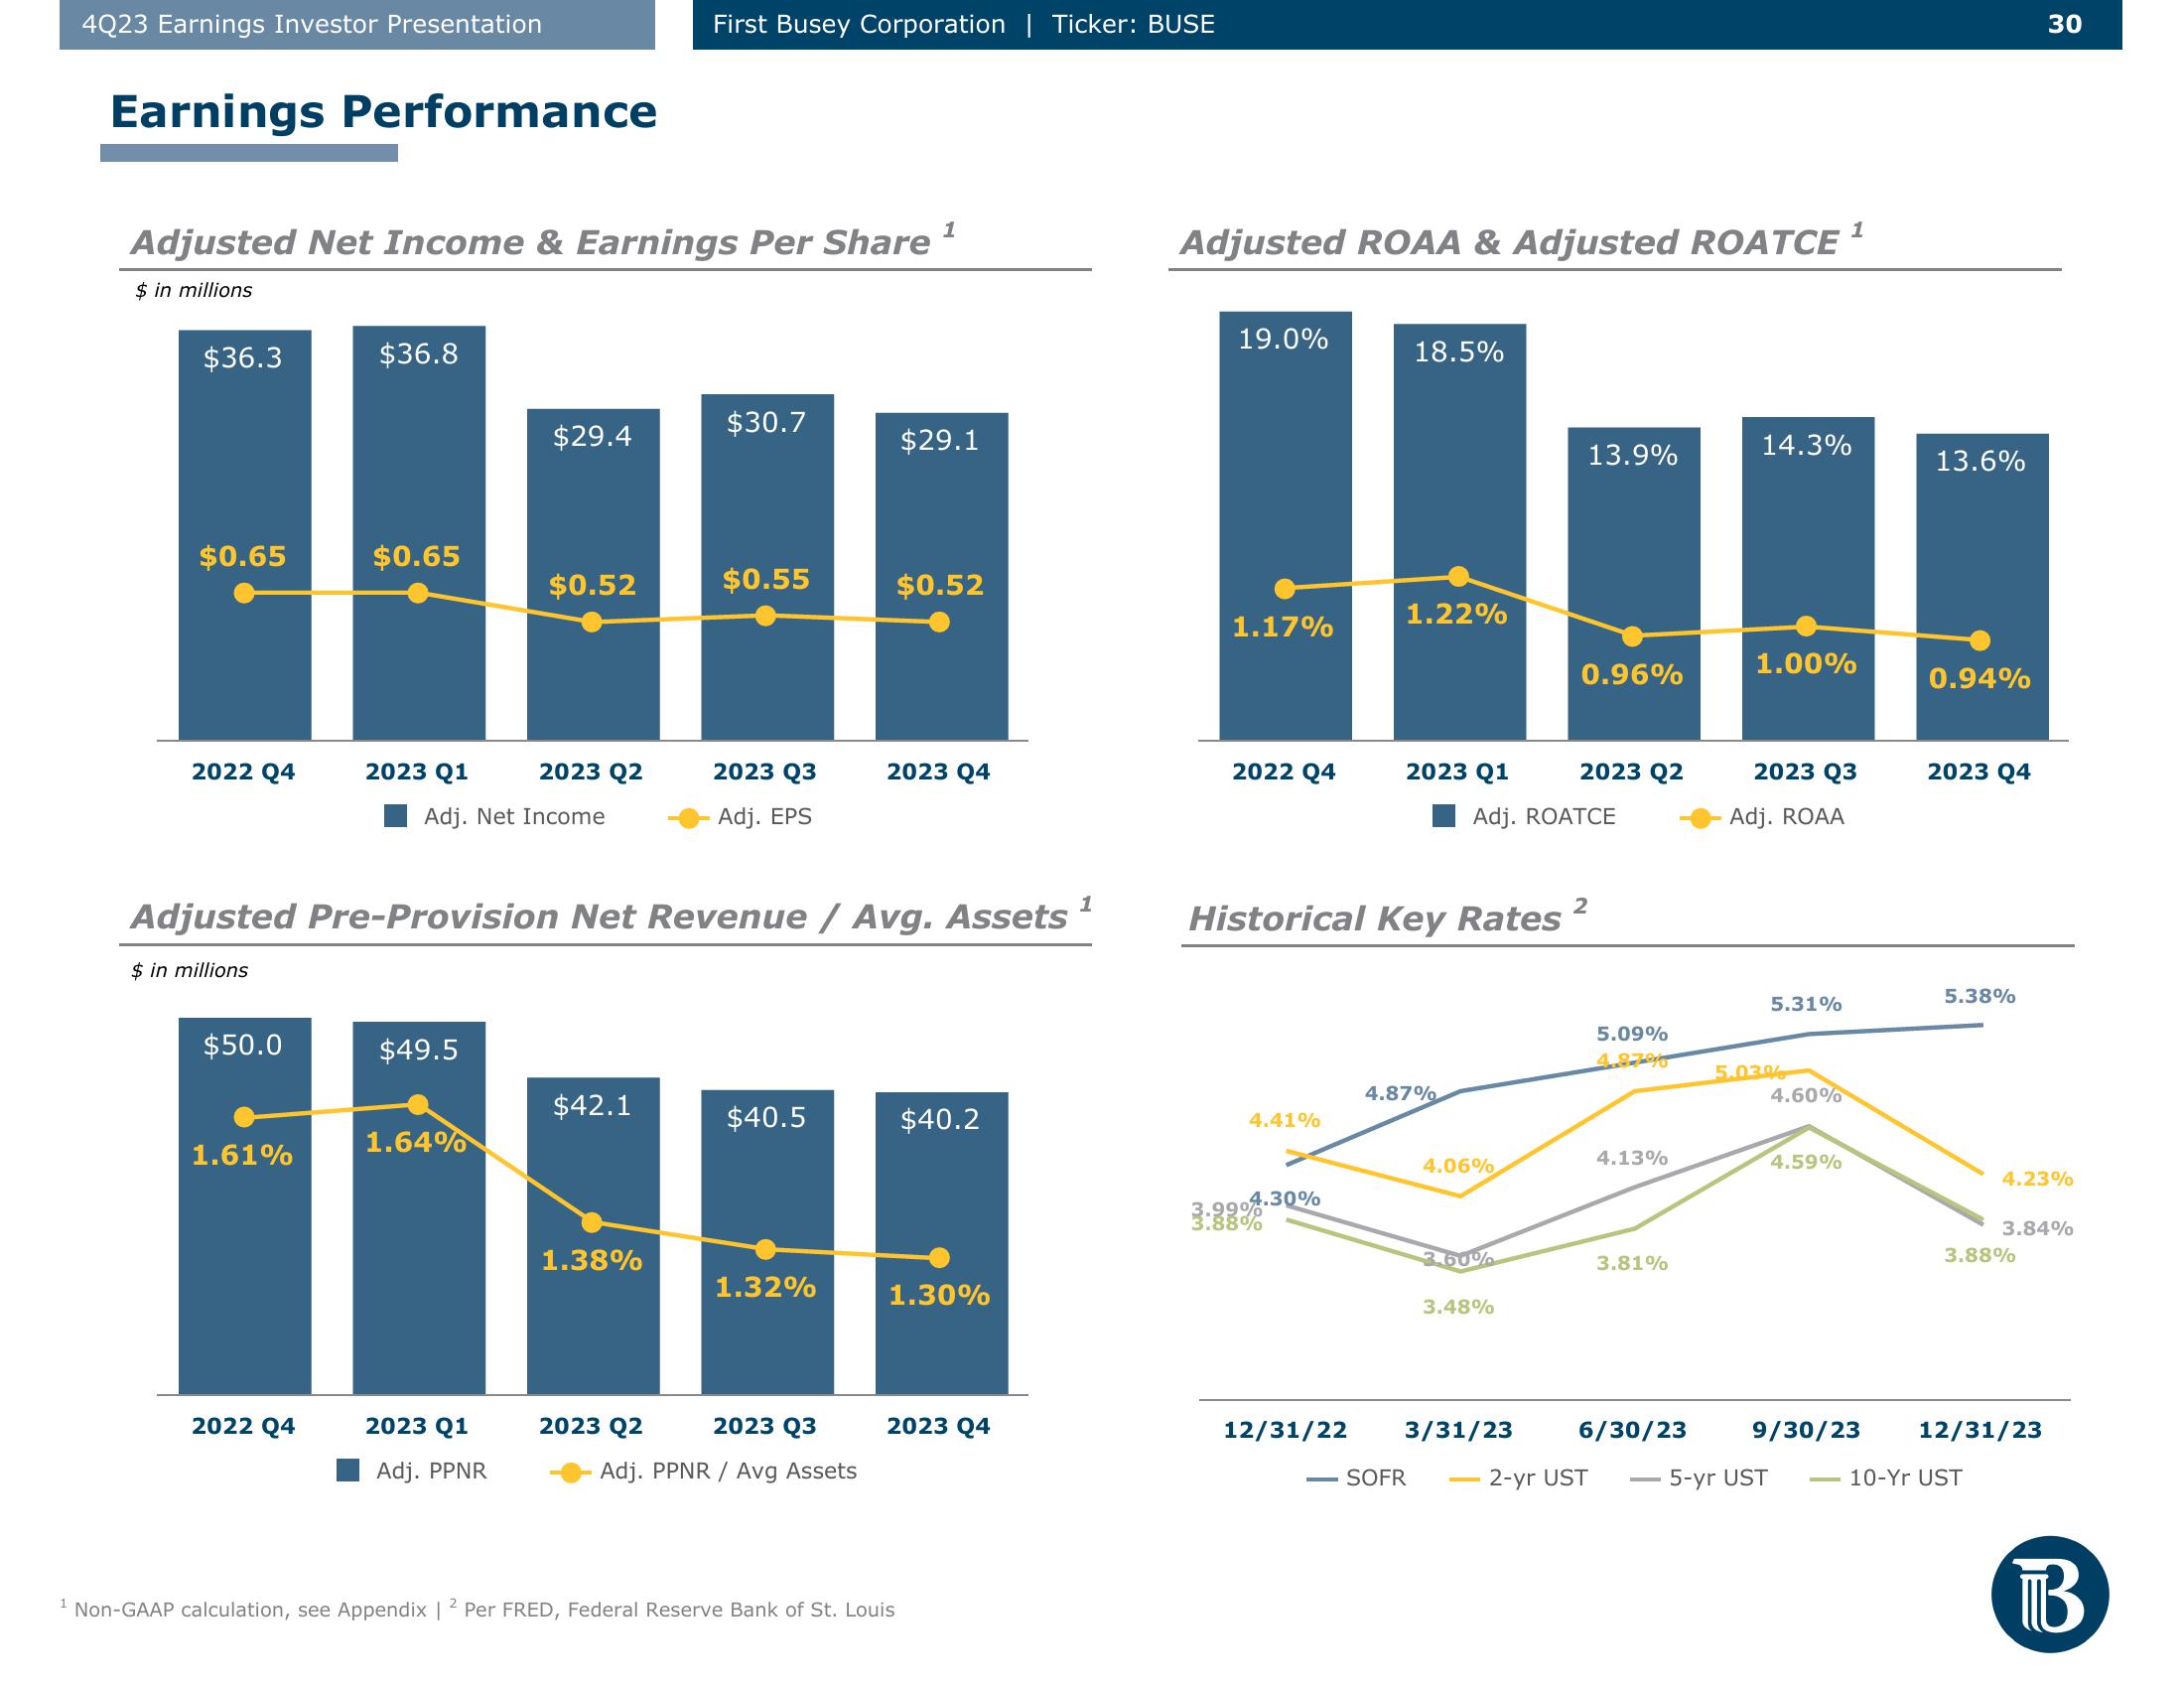
Adjusted Net Income & Earnings Per Share ¹
$ in millions
$36.3
$0.65
2022 Q4
$50.0
1.61%
$36.8
2022 Q4
$0.65
2023 Q1
$49.5
$29.4
Adj. Net Income
1.64%
$0.52
2023 Q1
Adj. PPNR
2023 Q2
First Busey Corporation | Ticker: BUSE
Adjusted Pre-Provision Net Revenue / Avg. Assets
$ in millions
$42.1
1.38%
$30.7
$0.55
2023 Q3
Adj. EPS
$40.5
1.32%
2023 Q2 2023 Q3
Adj. PPNR / Avg Assets
$29.1
$0.52
2023 Q4
$40.2
1.30%
¹ Non-GAAP calculation, see Appendix | 2 Per FRED, Federal Reserve Bank of St. Louis
2023 Q4
1
Adjusted ROAA & Adjusted ROATCE
19.0%
1.17%
2022 Q4
4.41%
4.30%
3.99%
3.88%
18.5%
1.22%
2023 Q1
Historical Key Rates ²
4.87%
SOFR
4.06%
Adj. ROATCE
2.60%
13.9%
3.48%
12/31/22 3/31/23
0.96%
2023 Q2
5.09%
4.8790
2-yr UST
4.13%
3.81%
6/30/23
14.3%
1.00%
2023 Q3
Adj. ROAA
5.31%
5.03%
5-yr UST
1
4.60%
4.59%
9/30/23
13.6%
0.94%
2023 Q4
5.38%
4.23%
3.88%
10-Yr UST
30
3.84%
12/31/23
BView entire presentation