Grove Results Presentation Deck
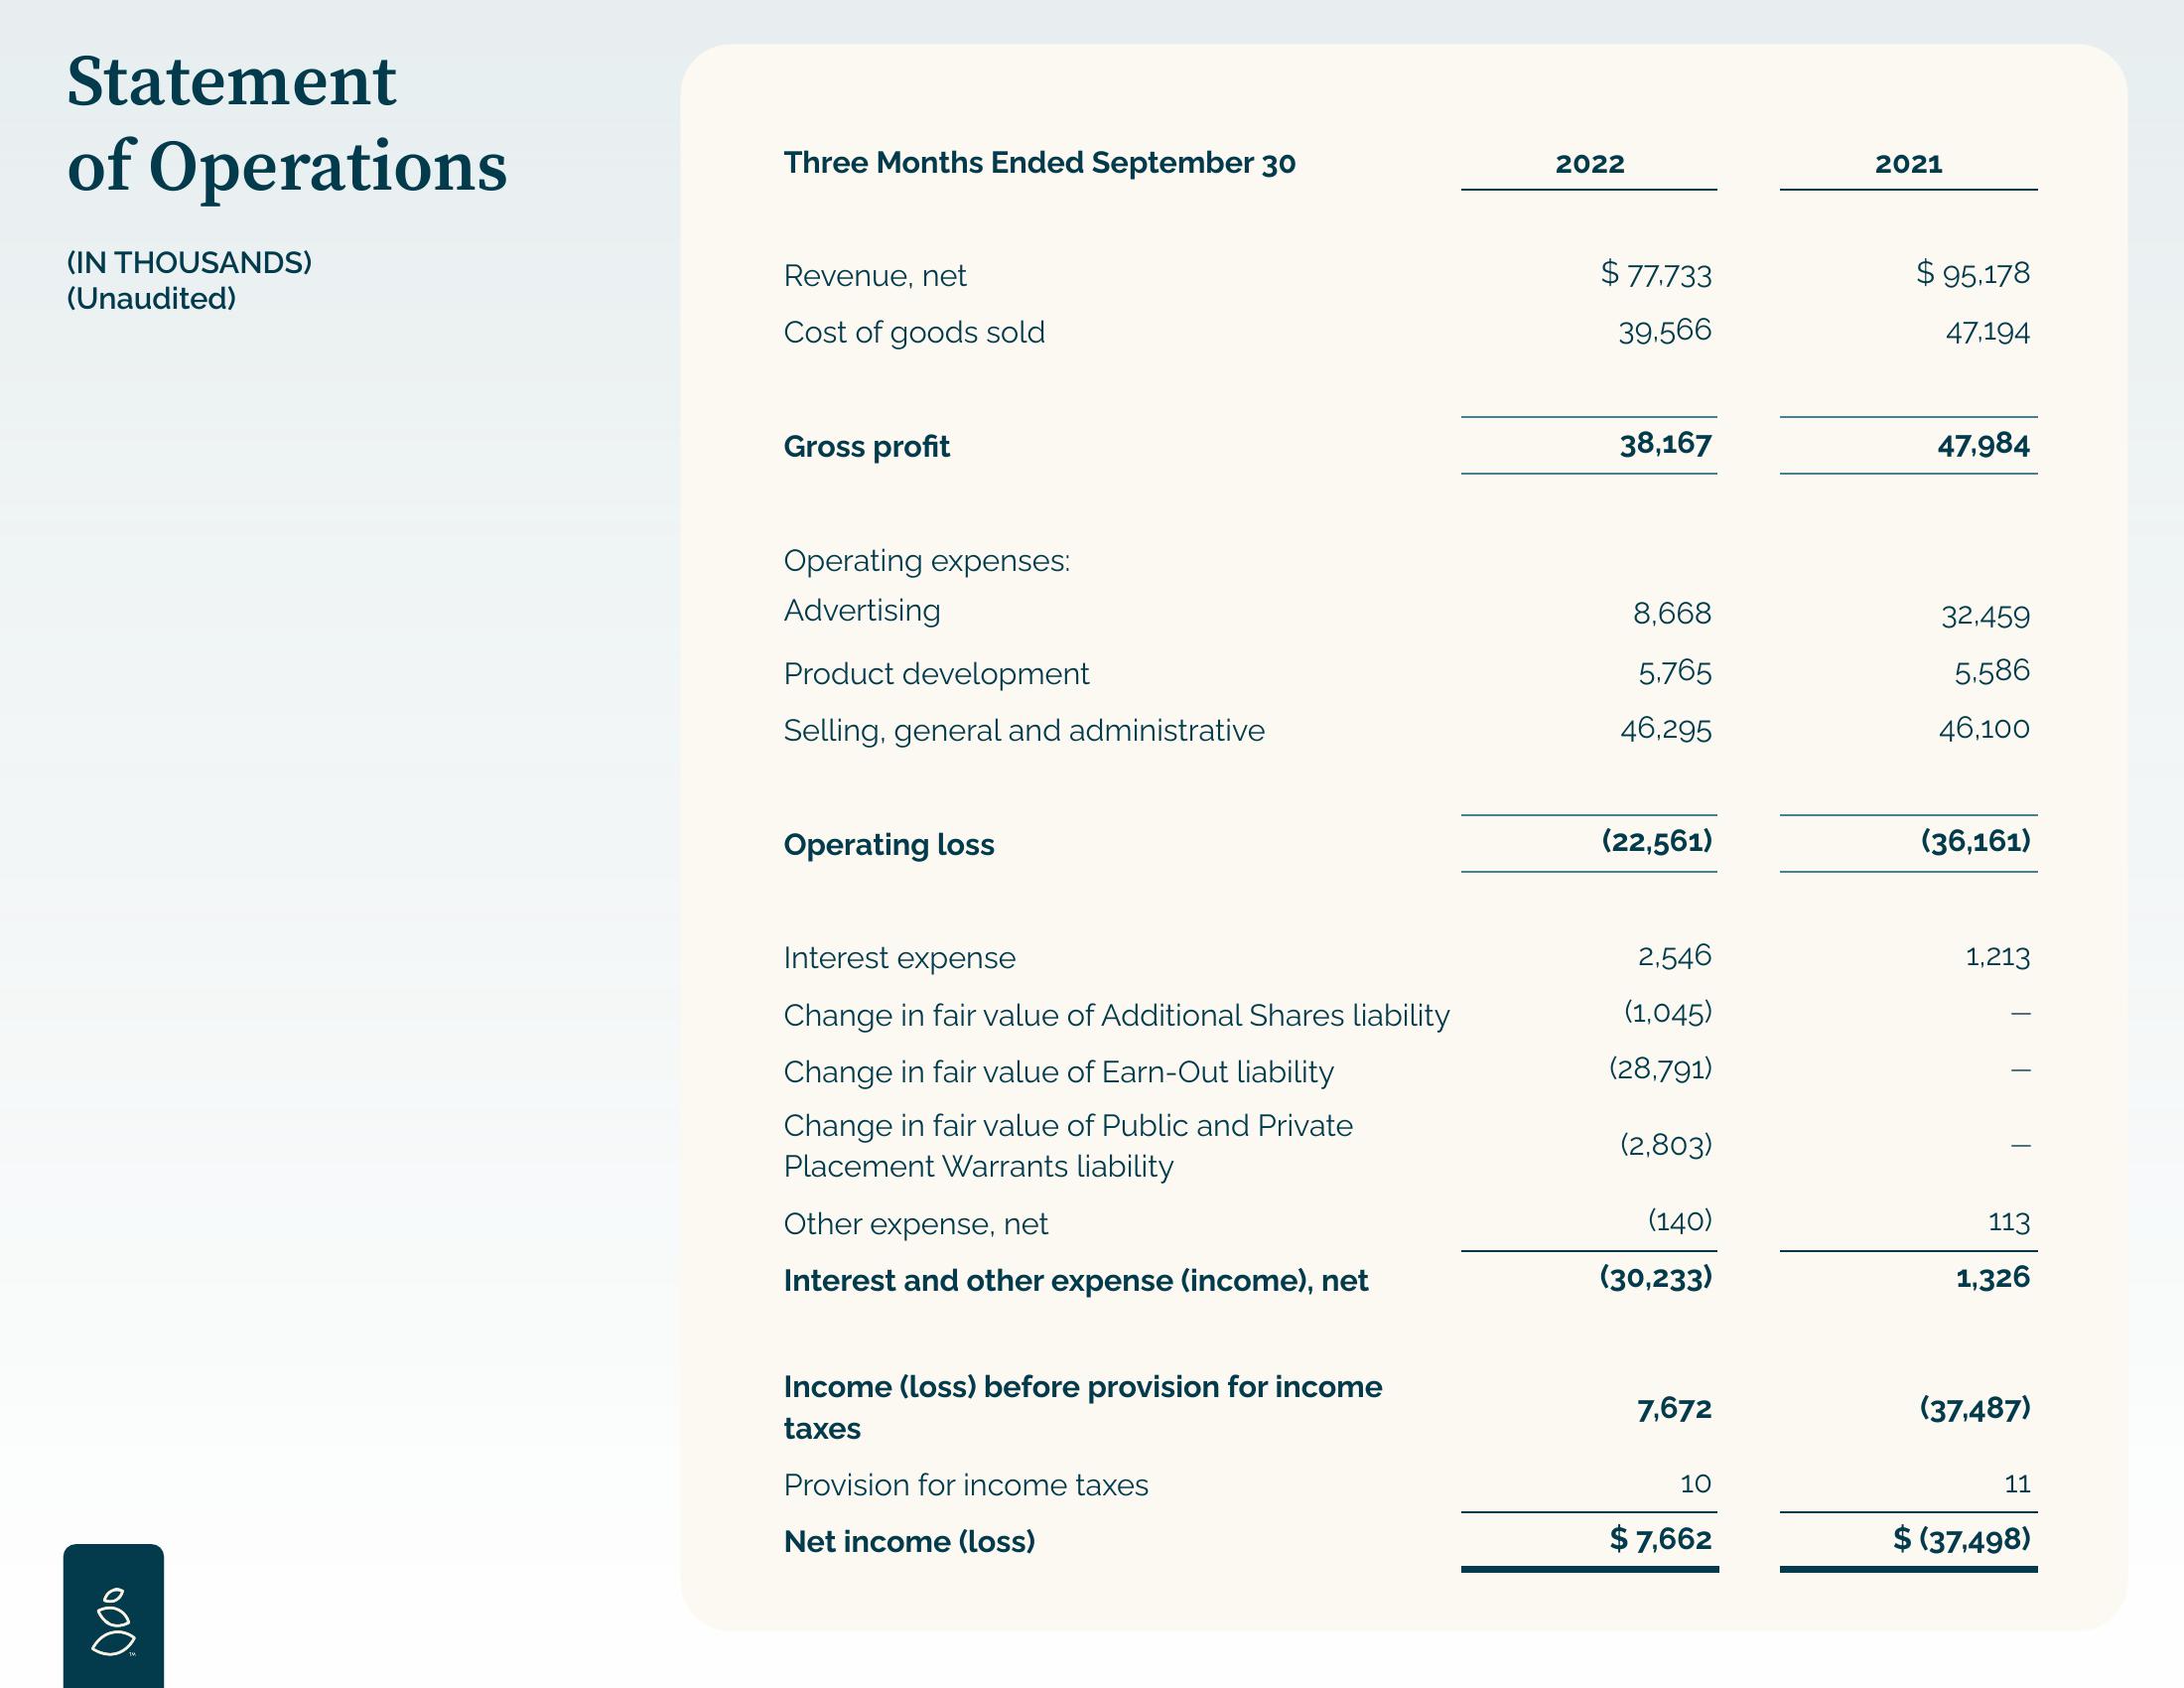
Statement
of Operations
(IN THOUSANDS)
(Unaudited)
000
Three Months Ended September 30
Revenue, net
Cost of goods sold
Gross profit
Operating expenses:
Advertising
Product development
Selling, general and administrative
Operating loss
Interest expense
Change in fair value of Additional Shares liability
Change in fair value of Earn-Out liability
Change in fair value of Public and Private
Placement Warrants liability
Other expense, net
Interest and other expense (income), net
Income (loss) before provision for income
taxes
Provision for income taxes
Net income (loss)
2022
$77.733
39,566
38,167
8,668
5.765
46,295
(22,561)
2,546
(1,045)
(28,791)
(2,803)
(140)
(30,233)
7,672
10
$7,662
2021
$ 95,178
47,194
47,984
32,459
5.586
46,100
(36,161)
1,213
-
T
113
1,326
(37,487)
11
$ (37,498)View entire presentation