Comcast Results Presentation Deck
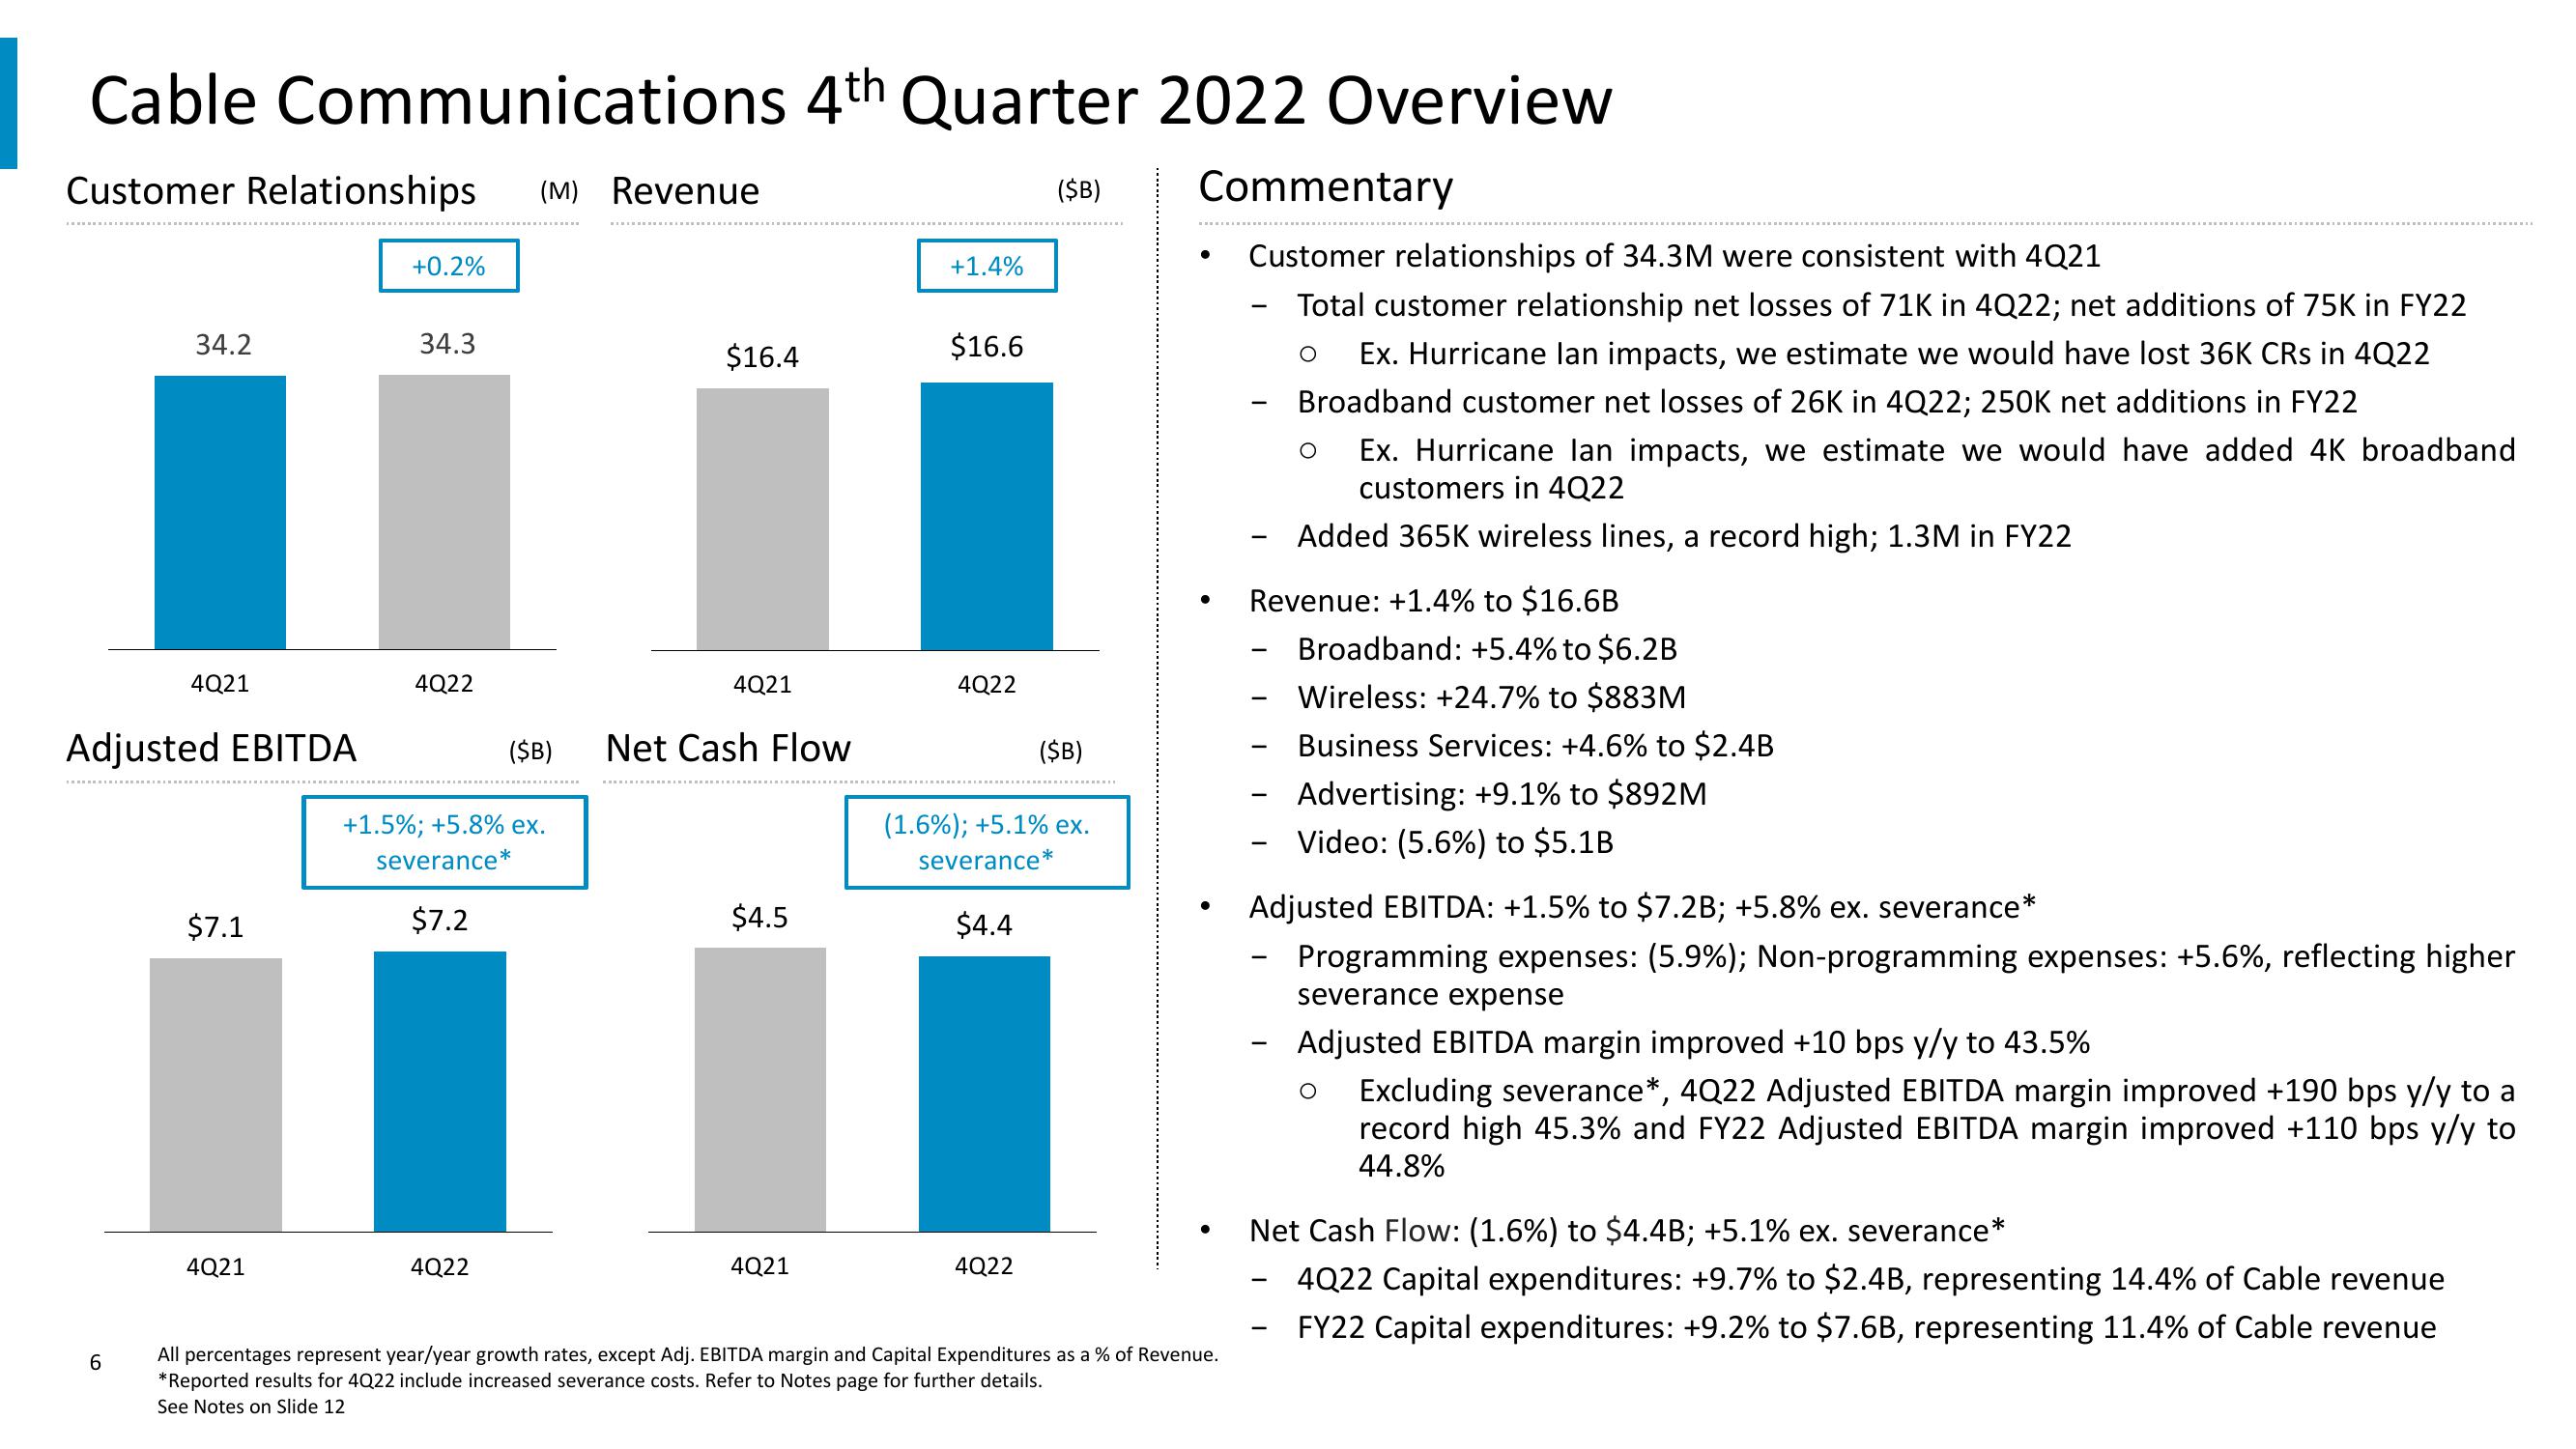
Cable Communications 4th Quarter 2022 Overview
Customer Relationships (M) Revenue
34.2
6
4Q21
Adjusted EBITDA
$7.1
4Q21
+0.2%
34.3
4Q22
+1.5%; +5.8% ex.
severance*
$7.2
4Q22
$16.4
4Q21
($B) Net Cash Flow
$4.5
4Q21
+1.4%
$16.6
4Q22
$4.4
($B)
(1.6%) ; +5.1% ex.
severance*
4Q22
($B)
Commentary
Customer relationships of 34.3M were consistent with 4Q21
Total customer relationship net losses of 71K in 4Q22; net additions of 75K in FY22
O
Ex. Hurricane lan impacts, we estimate we would have lost 36K CRs in 4Q22
Broadband customer net losses of 26K in 4Q22; 250K net additions in FY22
Ex. Hurricane lan impacts, we estimate we would have added 4K broadband
customers in 4Q22
Added 365K wireless lines, a record high; 1.3M in FY22
●
All percentages represent year/year growth rates, except Adj. EBITDA margin and Capital Expenditures as a % of Revenue.
*Reported results for 4Q22 include increased severance costs. Refer to Notes page for further details.
See Notes on Slide 12
Revenue: +1.4% to $16.6B
-
O
-
Broadband: +5.4% to $6.2B
Wireless: +24.7% to $883M
Business Services: +4.6% to $2.4B
Advertising: +9.1% to $892M
Video: (5.6%) to $5.1B
Adjusted EBITDA: +1.5% to $7.2B; +5.8% ex. severance*
Programming expenses: (5.9%); Non-programming expenses: +5.6%, reflecting higher
severance expense
Adjusted EBITDA margin improved +10 bps y/y to 43.5%
O Excluding severance*, 4Q22 Adjusted EBITDA margin improved +190 bps y/y to a
record high 45.3% and FY22 Adjusted EBITDA margin improved +110 bps y/y to
44.8%
Net Cash Flow: (1.6%) to $4.4B; +5.1% ex. severance*
4Q22 Capital expenditures: +9.7% to $2.4B, representing 14.4% of Cable revenue
FY22 Capital expenditures: +9.2% to $7.6B, representing 11.4% of Cable revenueView entire presentation