Investor Presentation
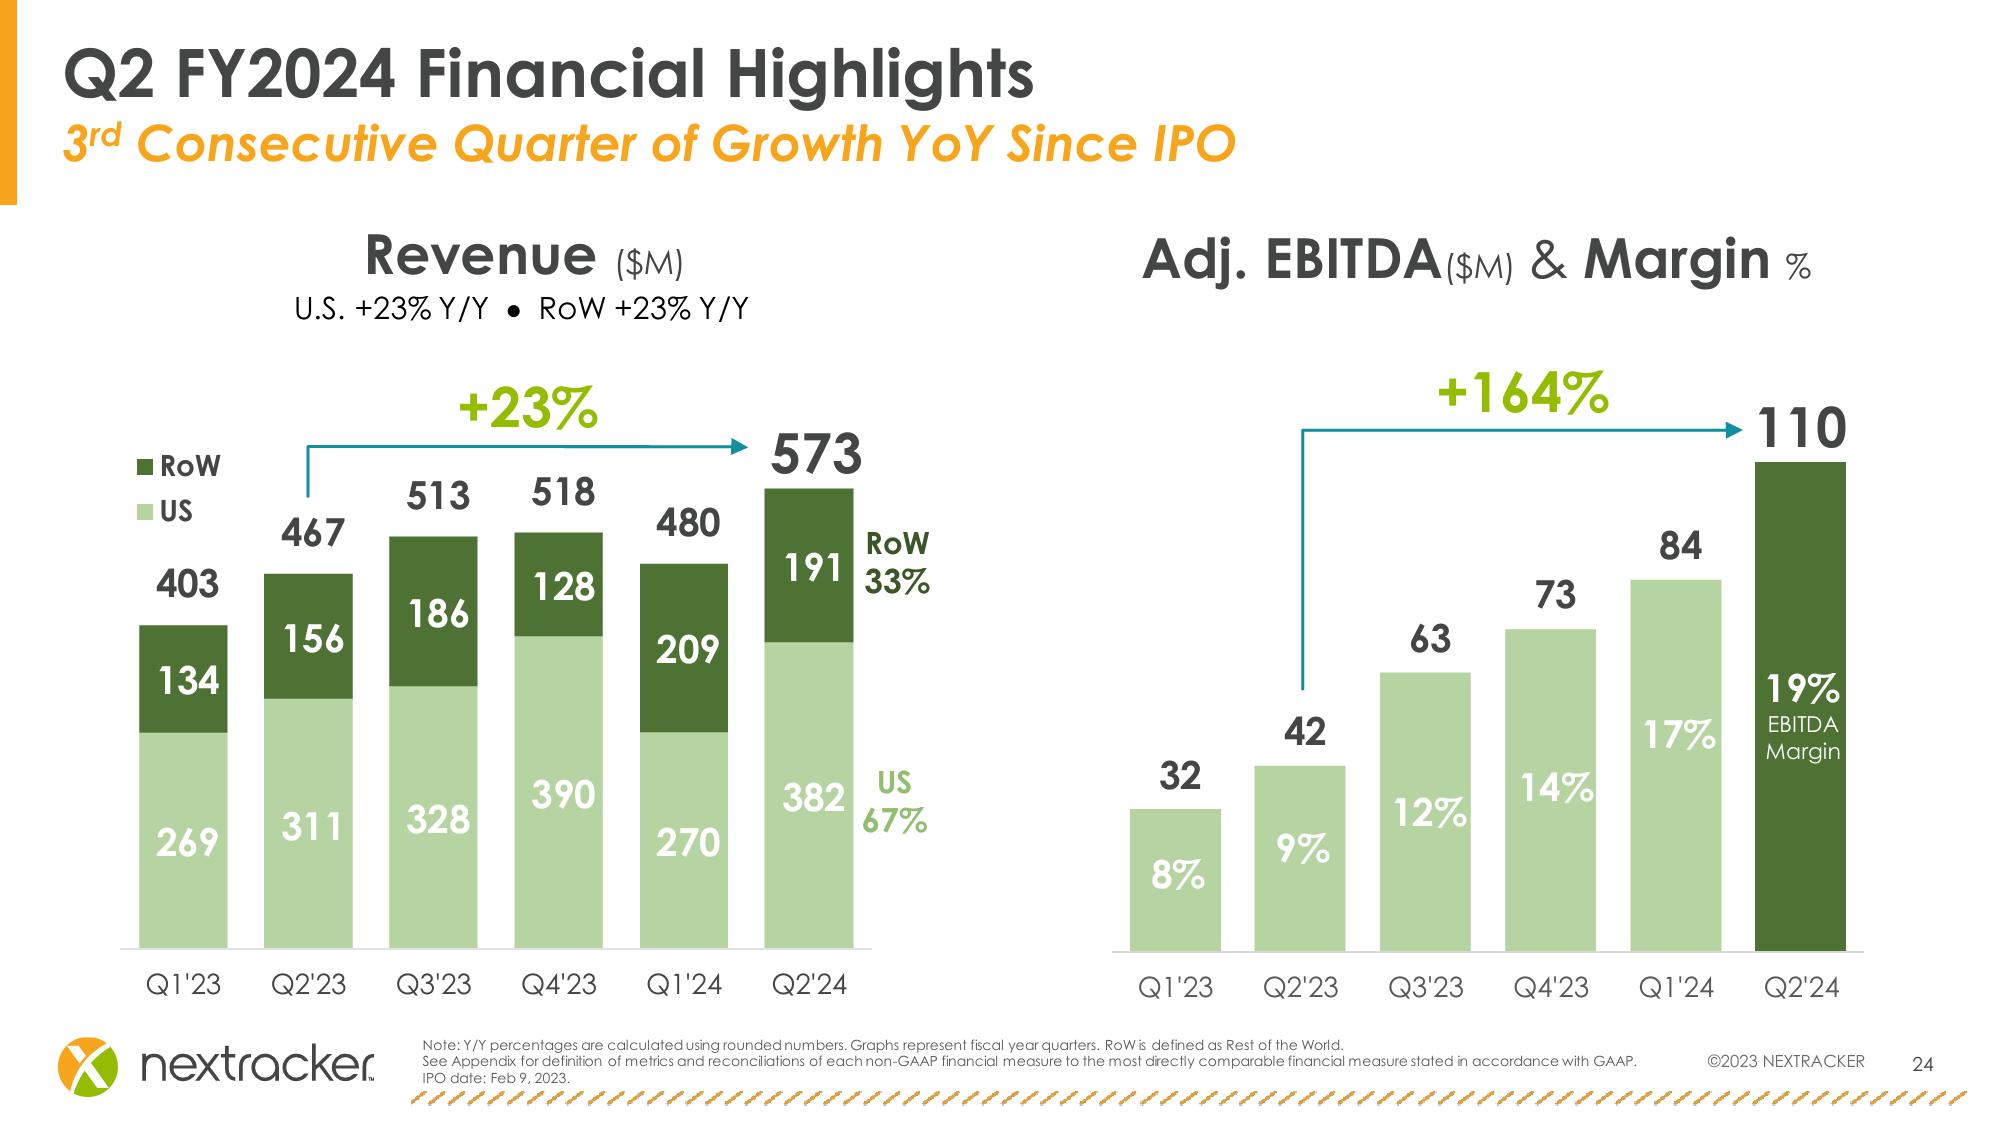
Q2 FY2024 Financial Highlights
3rd Consecutive Quarter of Growth YoY Since IPO
Revenue ($M)
U.S. +23% Y/Y • ROW +23% Y/Y
Adj. EBITDA ($M) & Margin %
+164%
+23%
■ROW
573
513
518
■US
467
480
ROW
191
403
128
33%
186
156
209
134
110
84
73
63
19%
42
17%
EBITDA
Margin
US
32
390
382
14%
311 328
67%
12%
269
270
9%
8%
Q1'23 Q2'23
Q3'23
Q4'23
Q1'24
nextracker.
Q2'24
Q1'23
Q2'23
Q3'23
Q4'23
Q1'24
Q2'24
Note: Y/Y percentages are calculated using rounded numbers. Graphs represent fiscal year quarters. RoW is defined as Rest of the World.
See Appendix for definition of metrics and reconciliations of each non-GAAP financial measure to the most directly comparable financial measure stated in accordance with GAAP.
IPO date: Feb 9, 2023.
©2023 NEXTRACKER
24View entire presentation