Pershing Square Activist Presentation Deck
Appendix
($ in thousands)
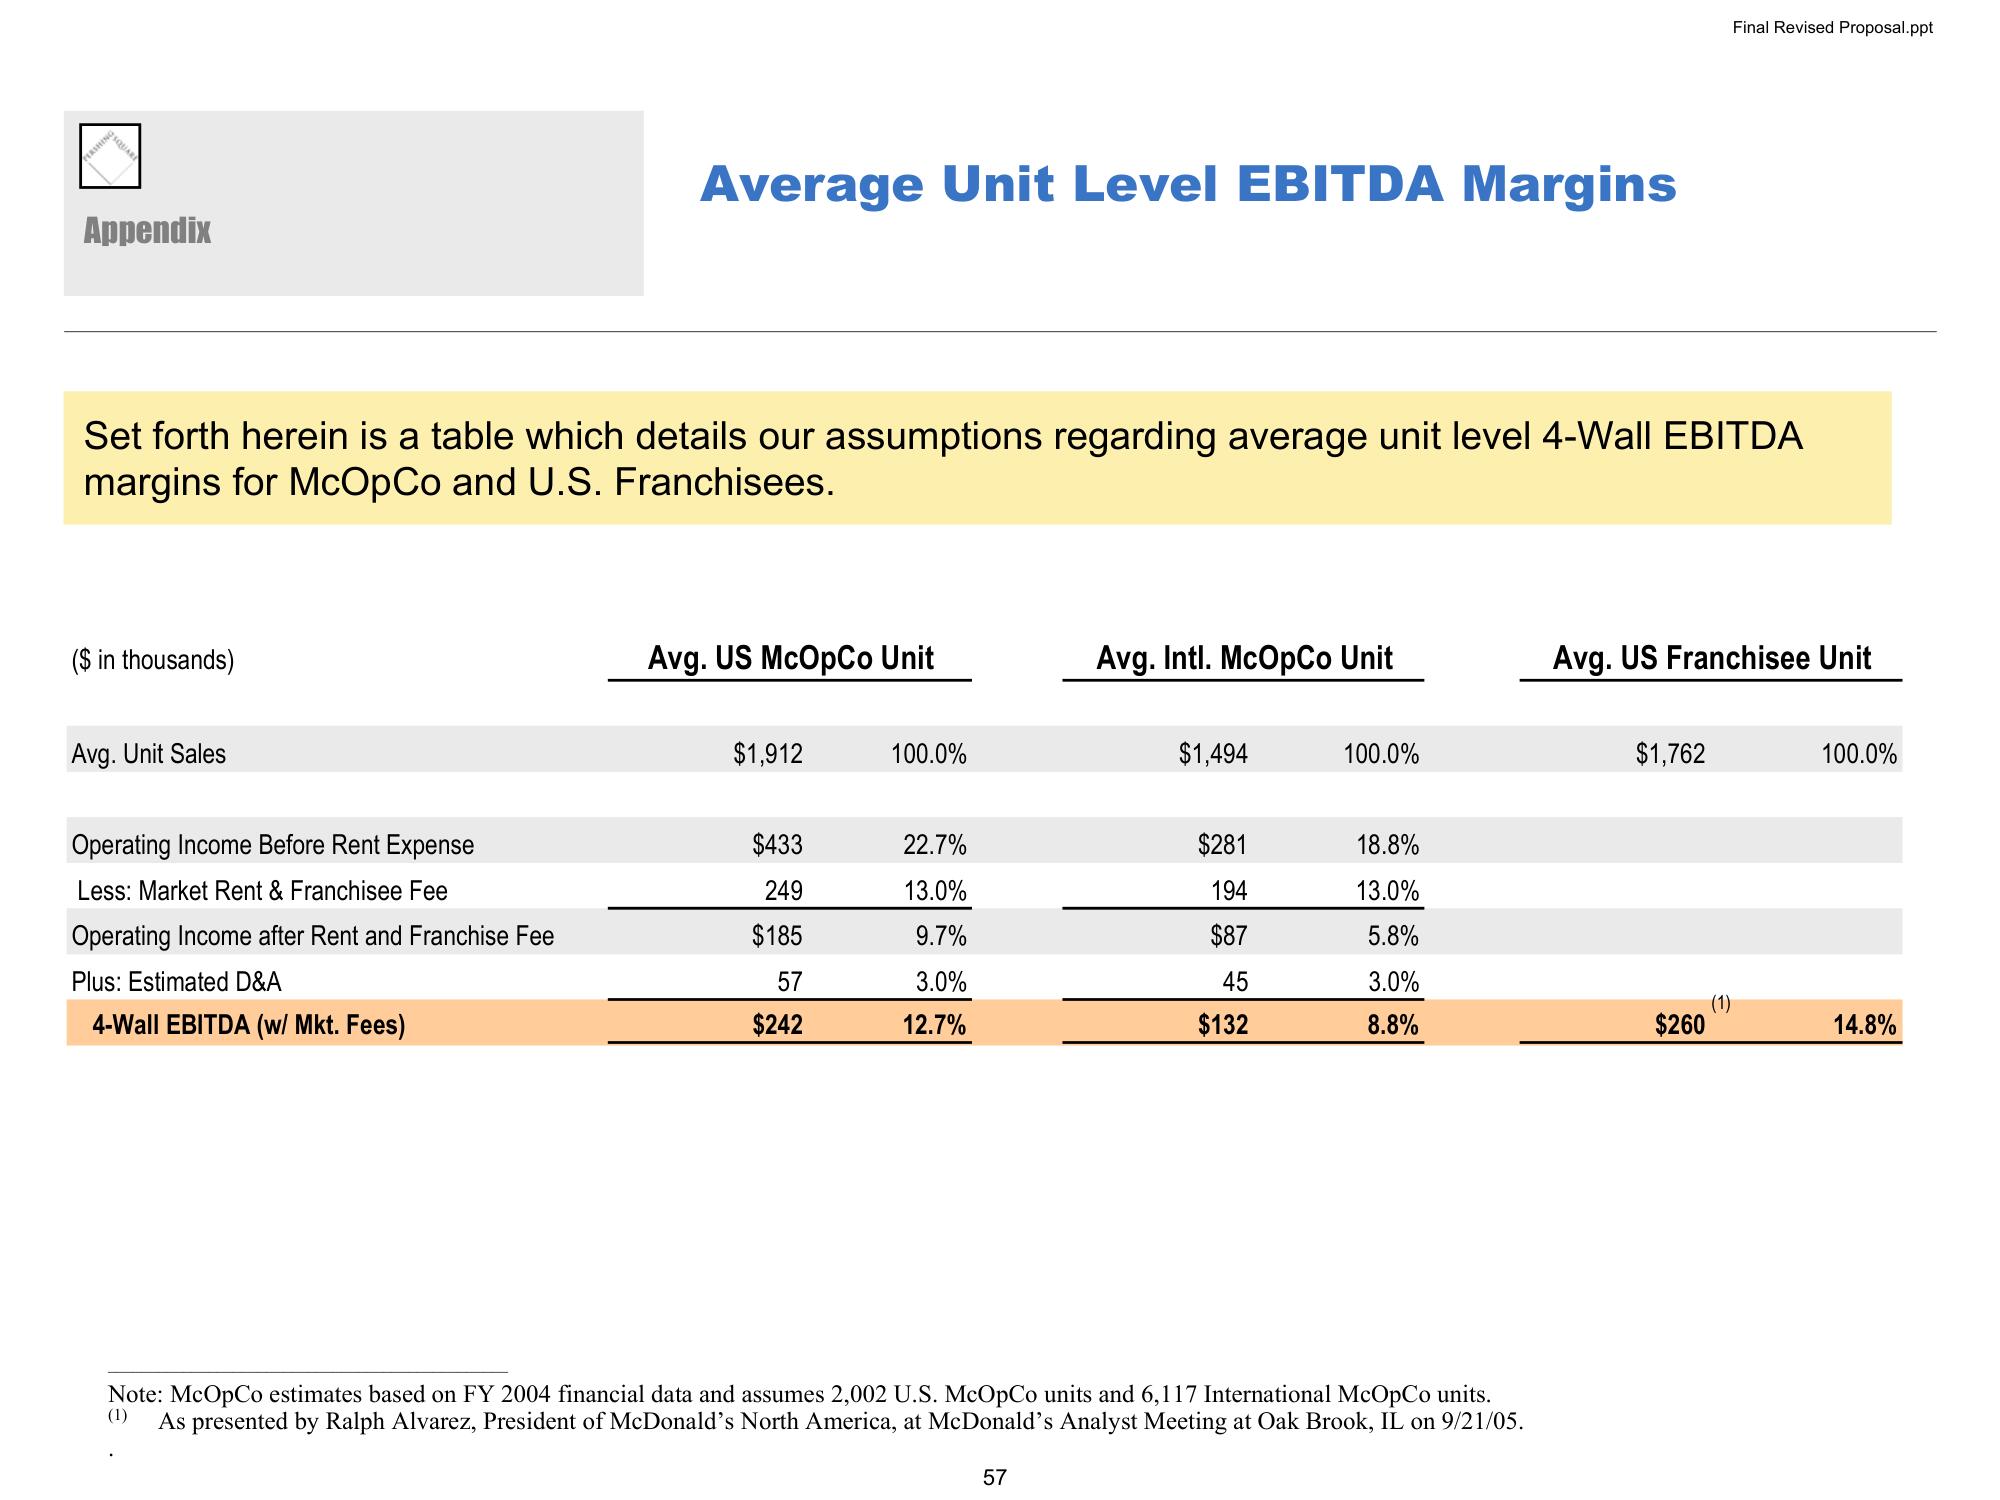
Set forth herein is a table which details our assumptions regarding average unit level 4-Wall EBITDA
margins for McOpCo and U.S. Franchisees.
Avg. Unit Sales
Operating Income Before Rent Expense
Less: Market Rent & Franchisee Fee
Operating Income after Rent and Franchise Fee
Average Unit Level EBITDA Margins
Plus: Estimated D&A
4-Wall EBITDA (w/ Mkt. Fees)
Avg. US McOpCo Unit
$1,912
$433
249
$185
57
$242
100.0%
22.7%
13.0%
9.7%
3.0%
12.7%
Avg. Intl. McOpCo Unit
$1,494
$281
194
$87
45
$132
100.0%
18.8%
13.0%
5.8%
3.0%
8.8%
Note: McOpCo estimates based on FY 2004 financial data and assumes 2,002 U.S. McOpCo units and 6,117 International McOpCo units.
(1)
As presented by Ralph Alvarez, President of McDonald's North America, at McDonald's Analyst Meeting at Oak Brook, IL on 9/21/05.
57
Avg. US Franchisee Unit
$1,762
Final Revised Proposal.ppt
$260
(1)
100.0%
14.8%View entire presentation