Nuvei Results Presentation Deck
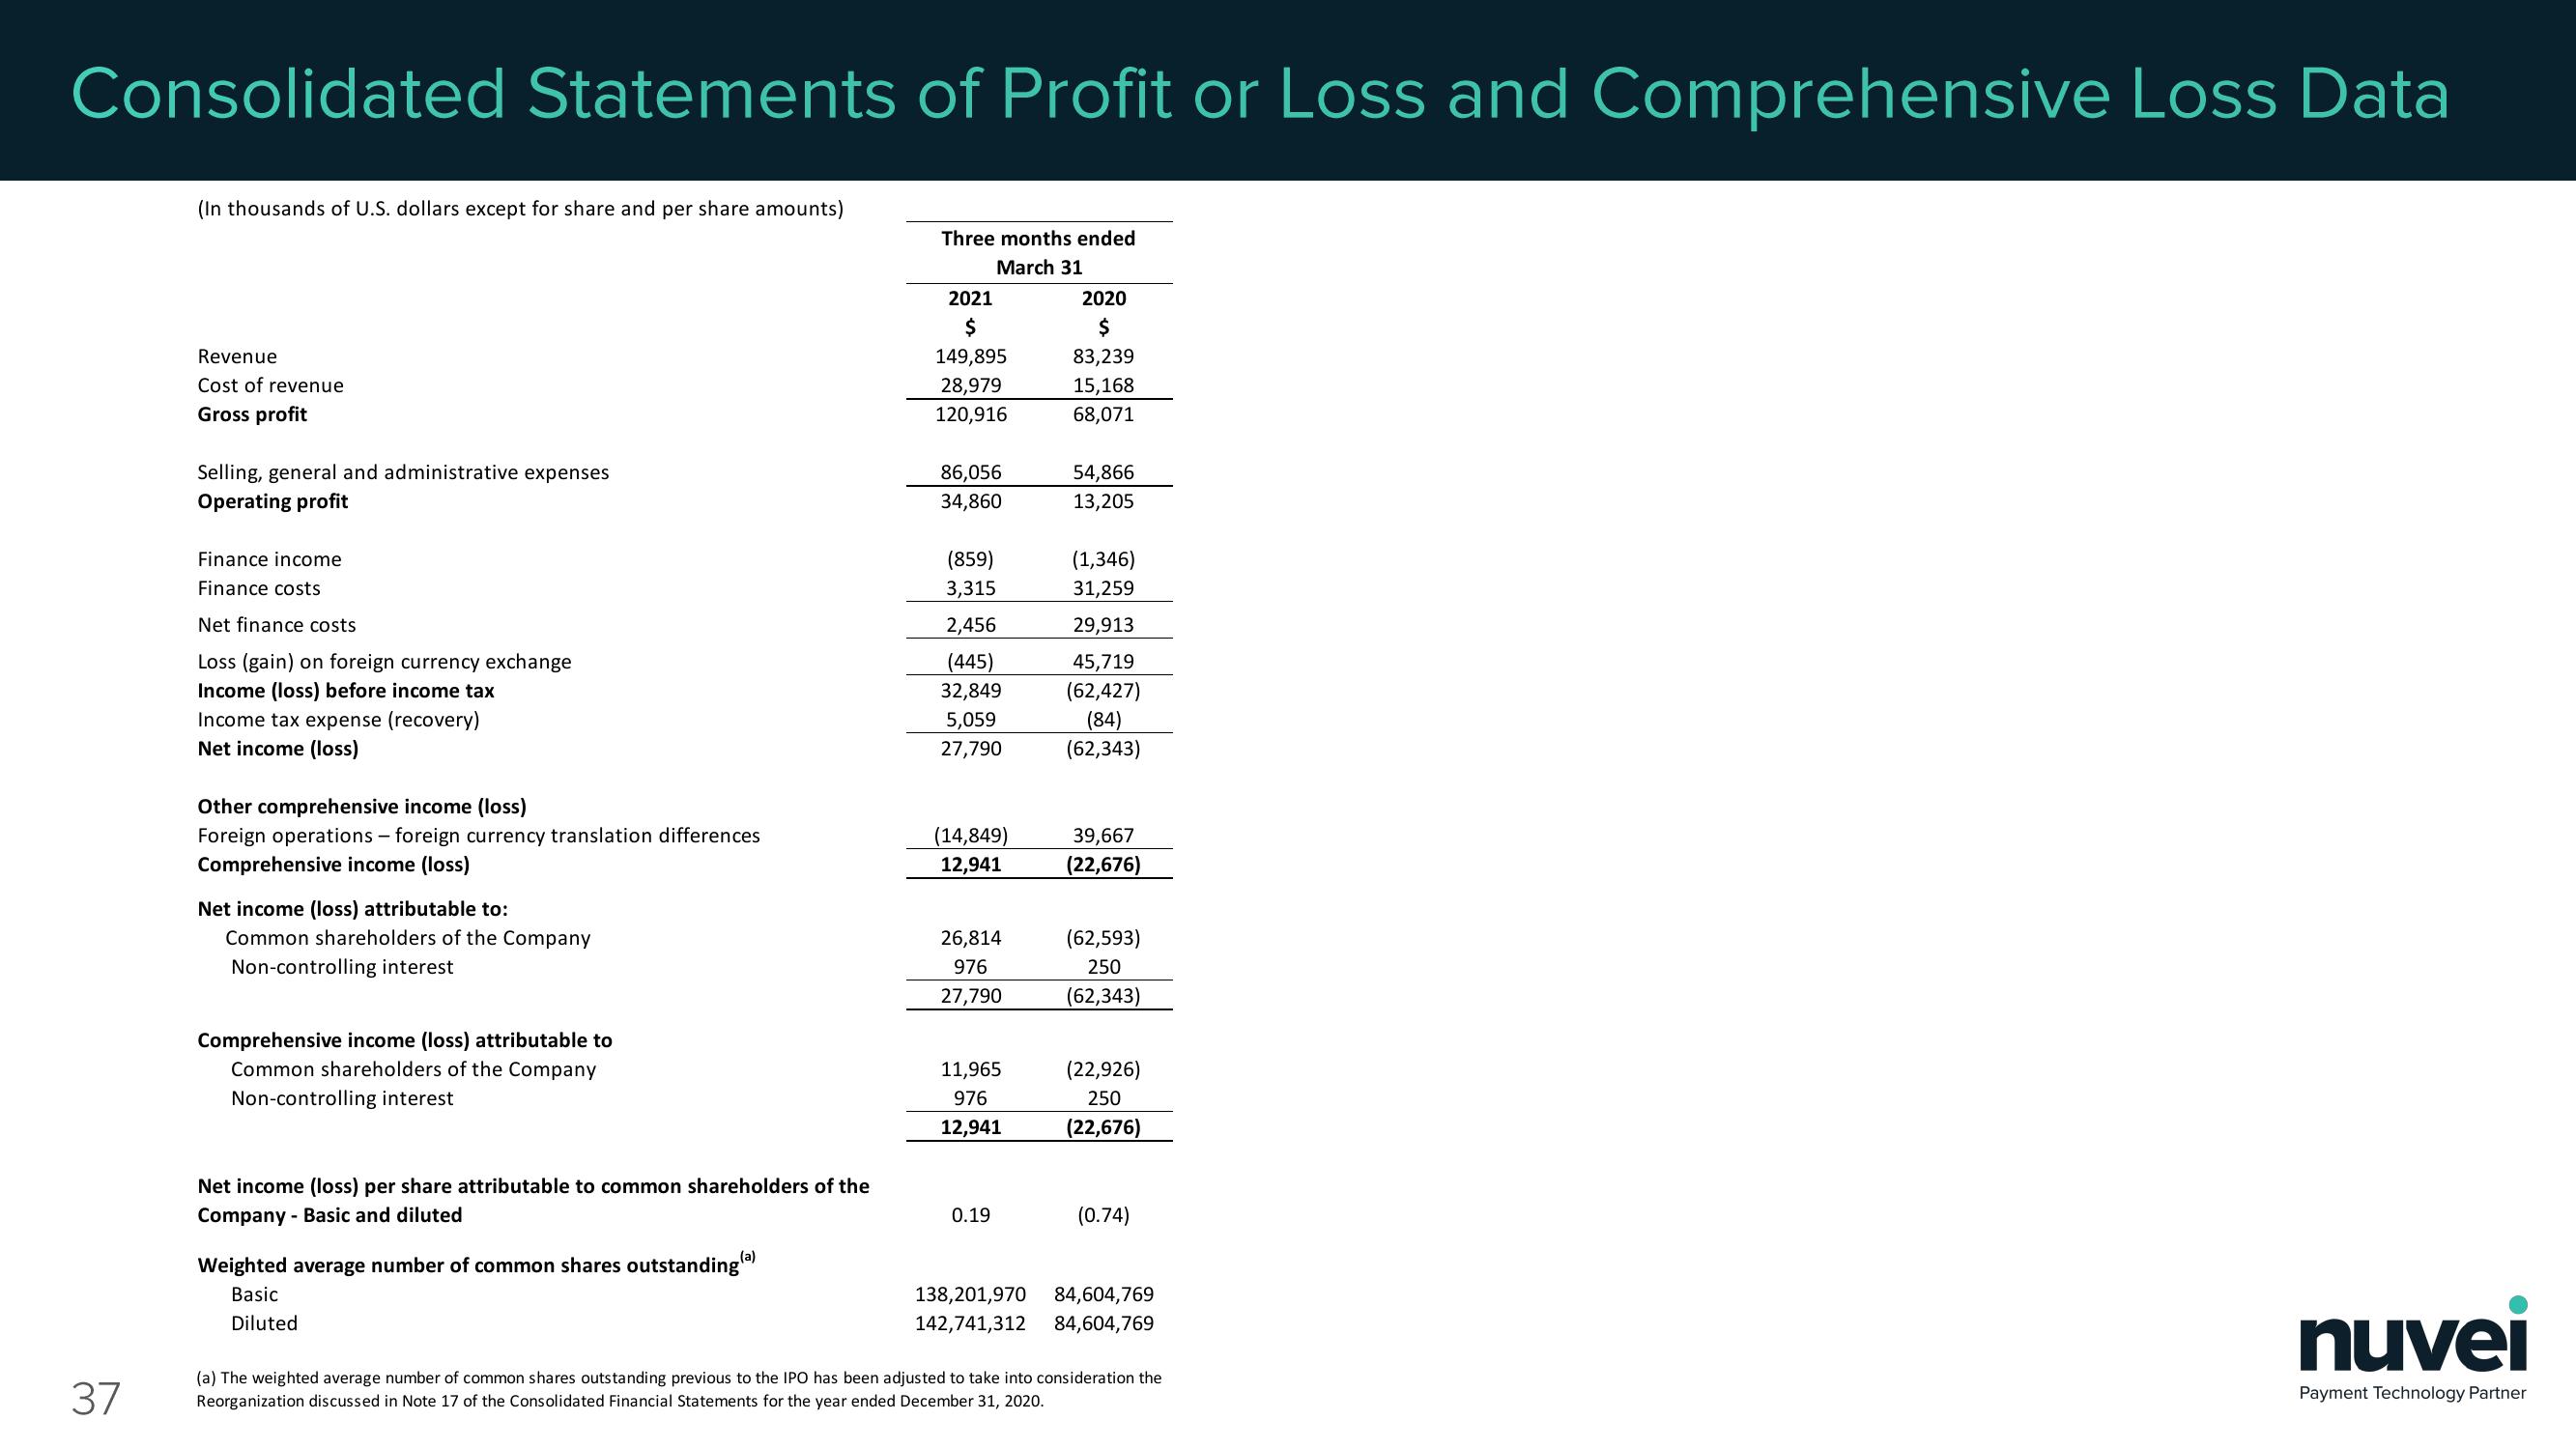
Consolidated Statements of Profit or Loss and Comprehensive Loss Data
37
(In thousands of U.S. dollars except for share and per share amounts)
Revenue
Cost of revenue
Gross profit
Selling, general and administrative expenses
Operating profit
Finance income
Finance costs
Net finance costs
Loss (gain) on foreign currency exchange
Income (loss) before income tax
Income tax expense (recovery)
Net income (loss)
Other comprehensive income (loss)
Foreign operations - foreign currency translation differences
Comprehensive income (loss)
Net income (loss) attributable to:
Common shareholders of the Company
Non-controlling interest
Comprehensive income (loss) attributable to
Common shareholders of the Company
Non-controlling interest
Net income (loss) per share attributable to common shareholders of the
Company - Basic and diluted
Weighted average number of common shares outstanding (a)
Basic
Diluted
Three months ended
March 31
2021
$
149,895
28,979
120,916
86,056
34,860
(859)
3,315
2,456
(445)
32,849
5,059
27,790
(14,849)
12,941
26,814
976
27,790
11,965
976
12,941
0.19
2020
$
83,239
15,168
68,071
54,866
13,205
(1,346)
31,259
29,913
45,719
(62,427)
(84)
(62,343)
39,667
(22,676)
(62,593)
250
(62,343)
(22,926)
250
(22,676)
(0.74)
138,201,970 84,604,769
142,741,312
84,604,769
(a) The weighted average number of common shares outstanding previous to the IPO has been adjusted to take into consideration the
Reorganization discussed in Note 17 of the Consolidated Financial Statements for the year ended December 31, 2020.
nuvei
Payment Technology PartnerView entire presentation