DiamondRock Hospitality Investor Presentation Deck
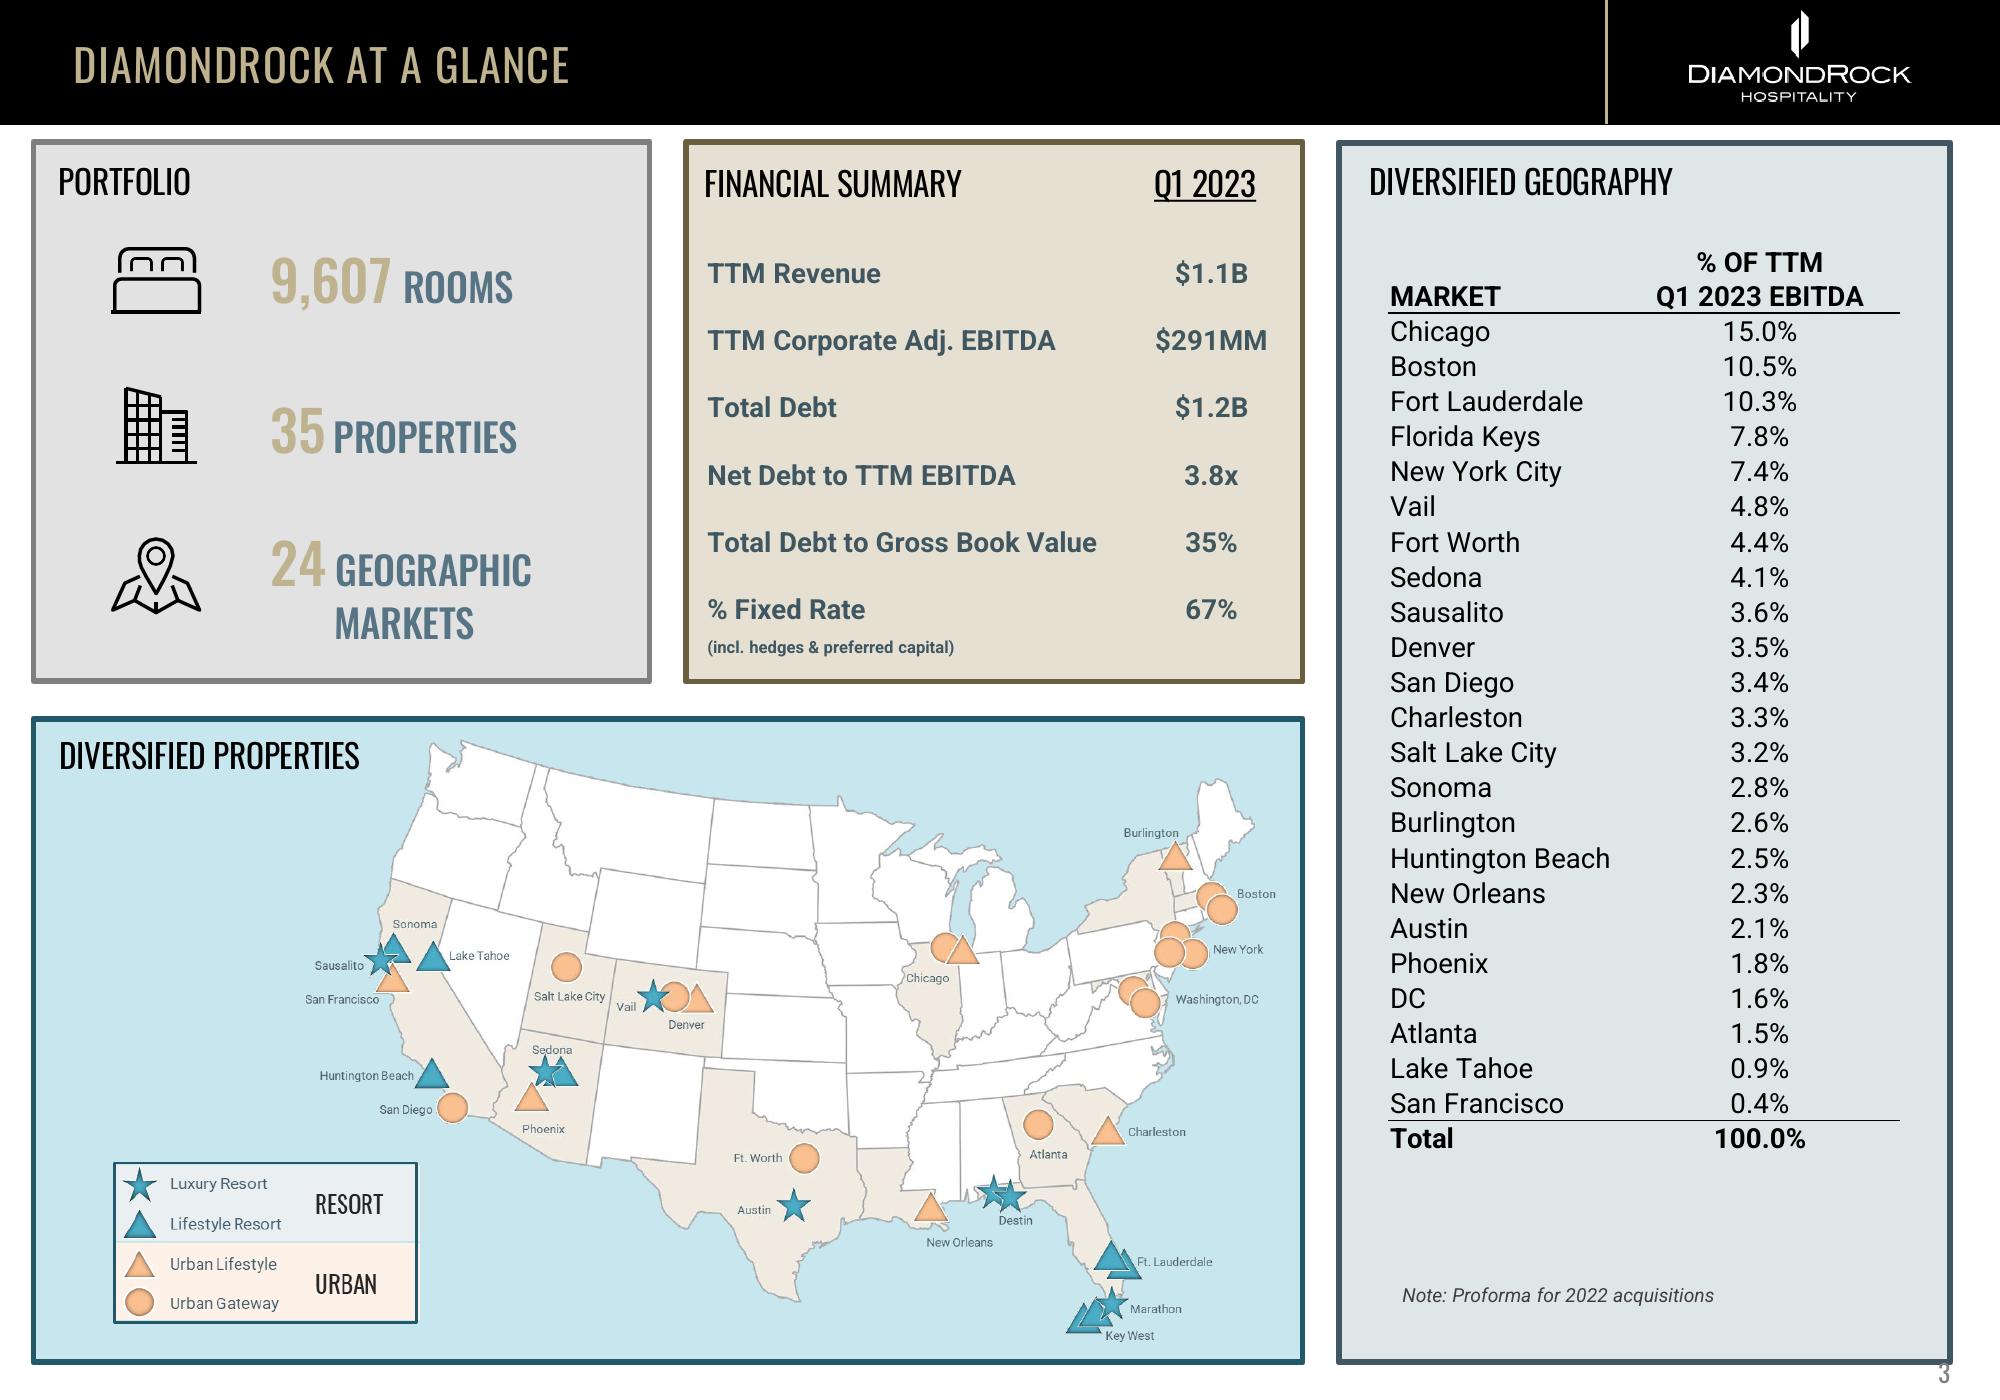
DIAMONDROCK AT A GLANCE
PORTFOLIO
9,607 ROOMS
35 PROPERTIES
24 GEOGRAPHIC
MARKETS
DIVERSIFIED PROPERTIES
Luxury Resort
Lifestyle Resort
Urban Lifestyle
Urban Gateway
Sausalito
San Francisco
Huntington Beach
Sonoma
RESORT
URBAN
San Diego
Lake Tahoe
Salt Lake City
Sedonal
Phoenix
Vail
FINANCIAL SUMMARY
Denver
TTM Revenue
TTM Corporate Adj. EBITDA
Total Debt
Net Debt to TTM EBITDA
Total Debt to Gross Book Value
% Fixed Rate
(incl. hedges & preferred capital)
Ft. Worth.
Austin
Chicago
New Orleans
Atlanta
Destin
Q1 2023
$1.1B
$291MM
$1.2B
Burlington
3.8x
35%
67%
Marathon
Key West
Charleston
Washington, DC
Ft. Lauderdale
Boston
New York
DIVERSIFIED GEOGRAPHY
MARKET
Chicago
Boston
Fort Lauderdale
Florida Keys
New York City
Vail
Fort Worth
Sedona
Sausalito
Denver
San Diego
Charleston
Salt Lake City
Sonoma
Burlington
Huntington Beach
New Orleans
Austin
Phoenix
DC
Atlanta
Lake Tahoe
San Francisco
Total
DIAMONDROCK
HOSPITALITY
% OF TTM
Q1 2023 EBITDA
15.0%
10.5%
10.3%
7.8%
7.4%
4.8%
4.4%
4.1%
3.6%
3.5%
3.4%
3.3%
3.2%
2.8%
2.6%
2.5%
2.3%
2.1%
1.8%
1.6%
1.5%
0.9%
0.4%
100.0%
Note: Proforma for 2022 acquisitionsView entire presentation