Main Street Capital Fixed Income Presentation Deck
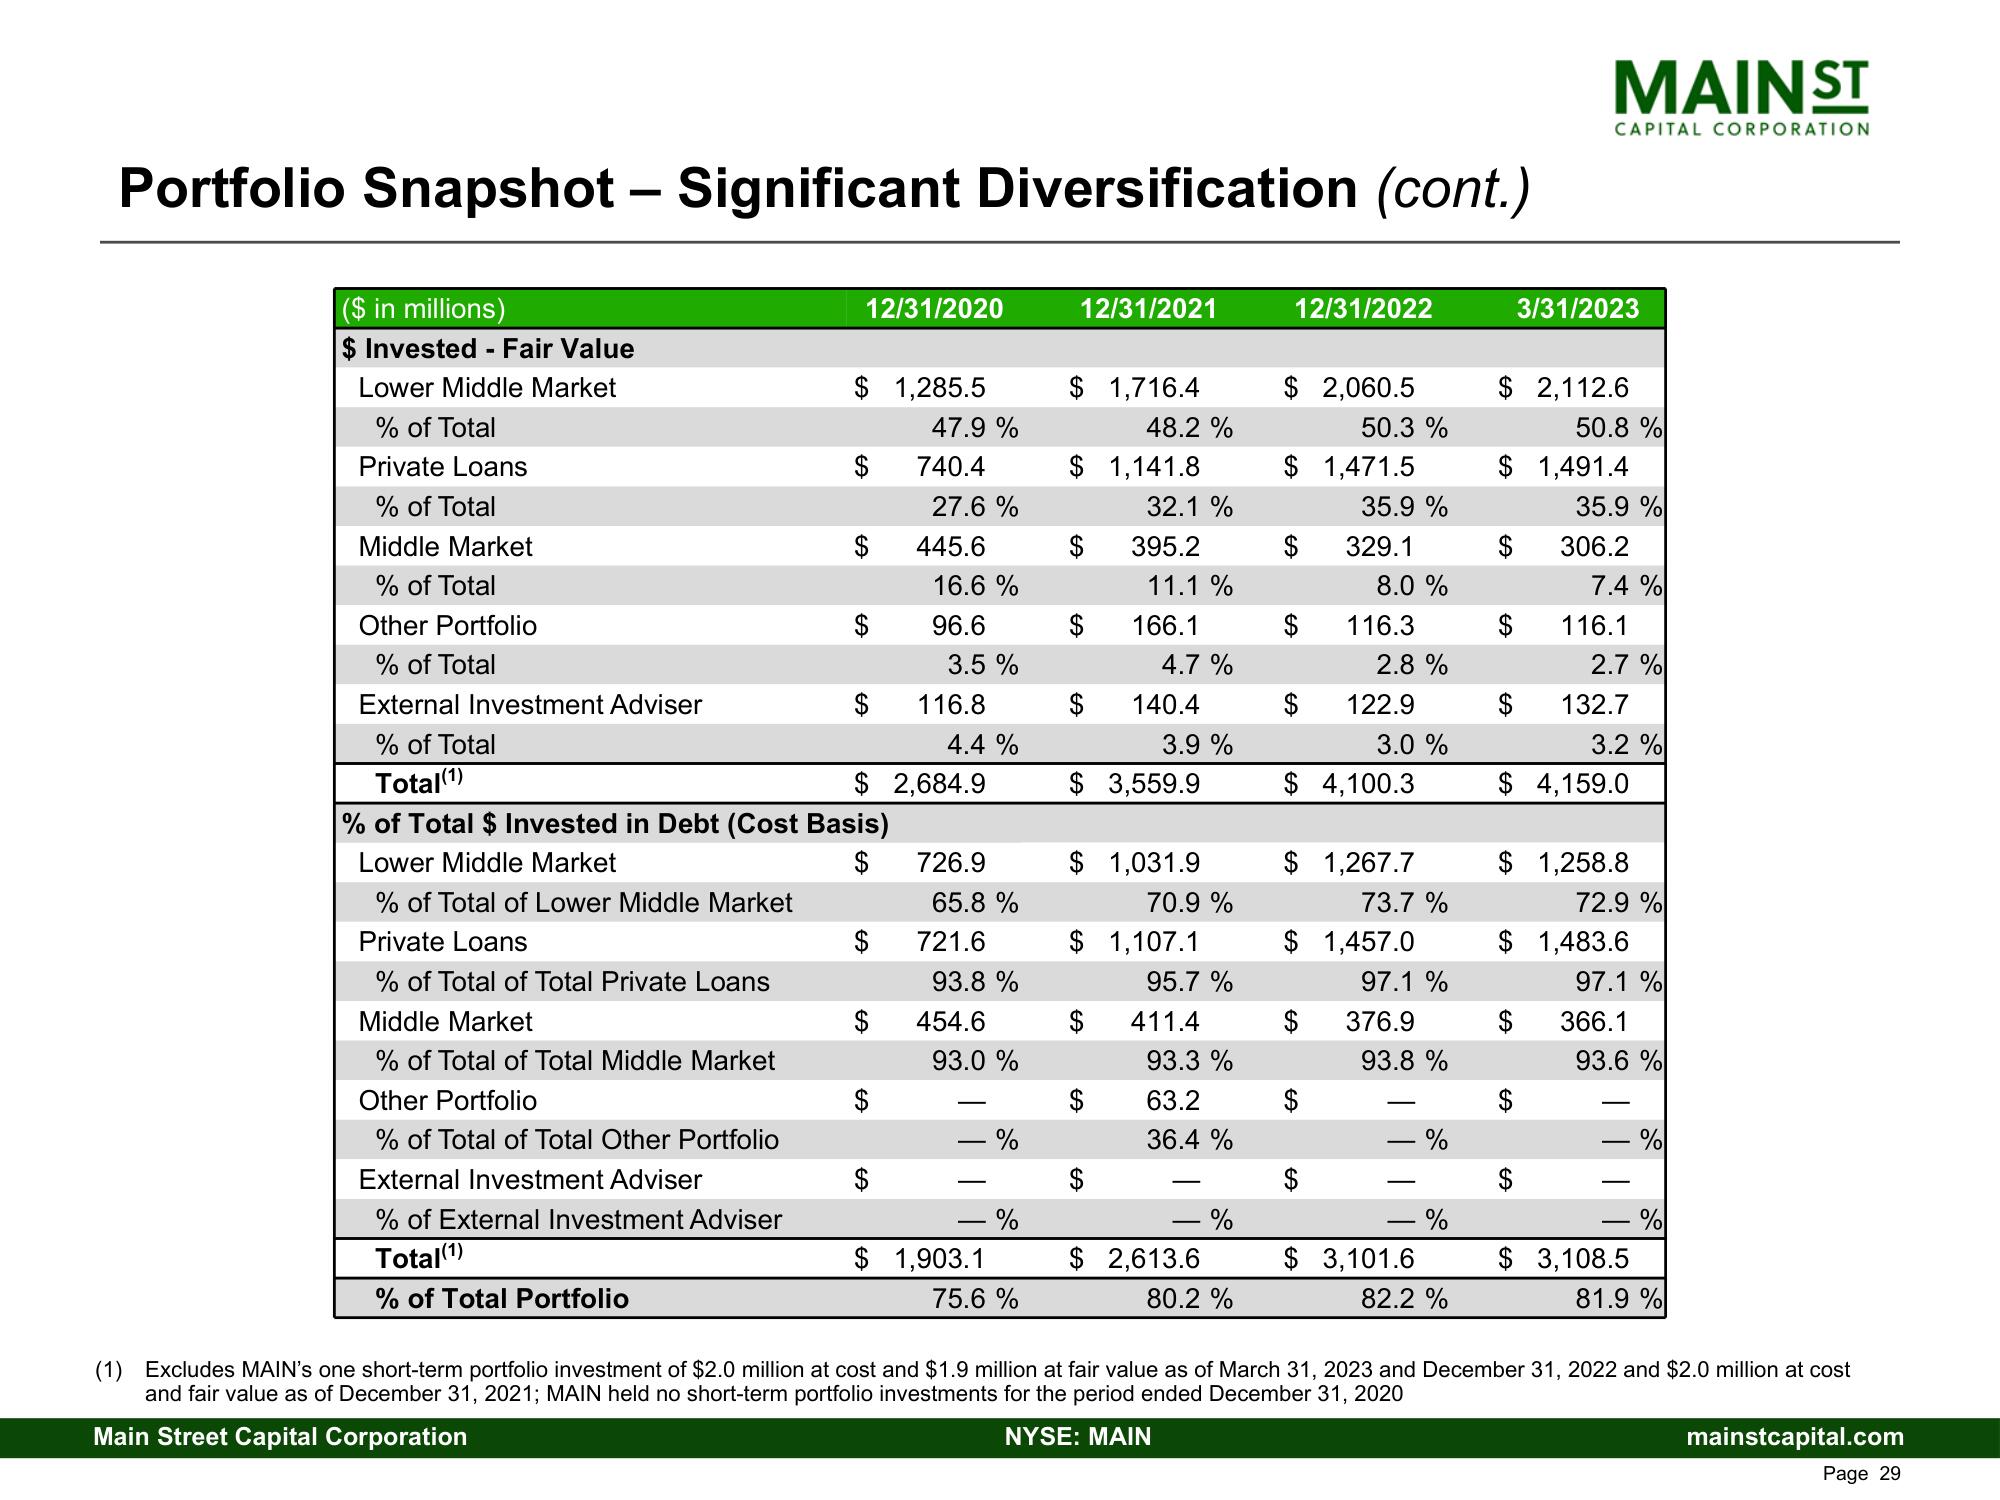
Portfolio Snapshot - Significant Diversification (cont.)
($ in millions)
$ Invested - Fair Value
Lower Middle Market
% of Total
Private Loans
% of Total
Middle Market
% of Total
Other Portfolio
% of Total
External Investment Adviser
% of Total
Total(1)
12/31/2020
$ 1,285.5
$
GA
SA
% of Total $ Invested in Debt (Cost Basis)
Lower Middle Market
$
% of Total of Lower Middle Market
Private Loans
% of Total of Total Private Loans
Middle Market
% of Total of Total Middle Market
Other Portfolio
% of Total of Total Other Portfolio
External Investment Adviser
% of External Investment Adviser
Total(1)
% of Total Portfolio
47.9 %
740.4
27.6%
445.6
16.6%
96.6
$
3.5 %
116.8
$ 2,684.9
4.4 %
726.9
65.8 %
721.6
93.8 %
454.6
93.0 %
- %
- %
$ 1,903.1
75.6 %
12/31/2021
$ 1,716.4
48.2 %
$1,141.8
32.1 %
395.2
11.1 %
166.1
$
$
$
4.7%
140.4
3.9 %
$ 3,559.9
$ 1,031.9
$
70.9 %
$ 1,107.1
95.7 %
411.4
93.3 %
63.2
36.4 %
-
$ 2,613.6
%
80.2 %
12/31/2022
$ 2,060.5
$ 1,471.5
$
$
50.3 %
$4,100.3
$
35.9 %
329.1
8.0 %
116.3
2.8 %
122.9
3.0 %
$1,267.7
73.7 %
$ 1,457.0
$
97.1 %
376.9
93.8 %
- %
- %
-
$ 3,101.6
82.2 %
$ 2,112.6
$
$
MAIN ST
CAPITAL CORPORATION
$ 1,491.4
$
3/31/2023
50.8 %
$
35.9 %
306.2
7.4 %
116.1
2.7 %
132.7
3.2 %
$ 4,159.0
$ 1,258.8
72.9 %
$ 1,483.6
97.1 %
366.1
93.6 %
-
$ 3,108.5
%
%
81.9 %
(1) Excludes MAIN's one short-term portfolio investment of $2.0 million at cost and $1.9 million at fair value as of March 31, 2023 and December 31, 2022 and $2.0 million at cost
and fair value as of December 31, 2021; MAIN held no short-term portfolio investments for the period ended December 31, 2020
Main Street Capital Corporation
NYSE: MAIN
mainstcapital.com
Page 29View entire presentation