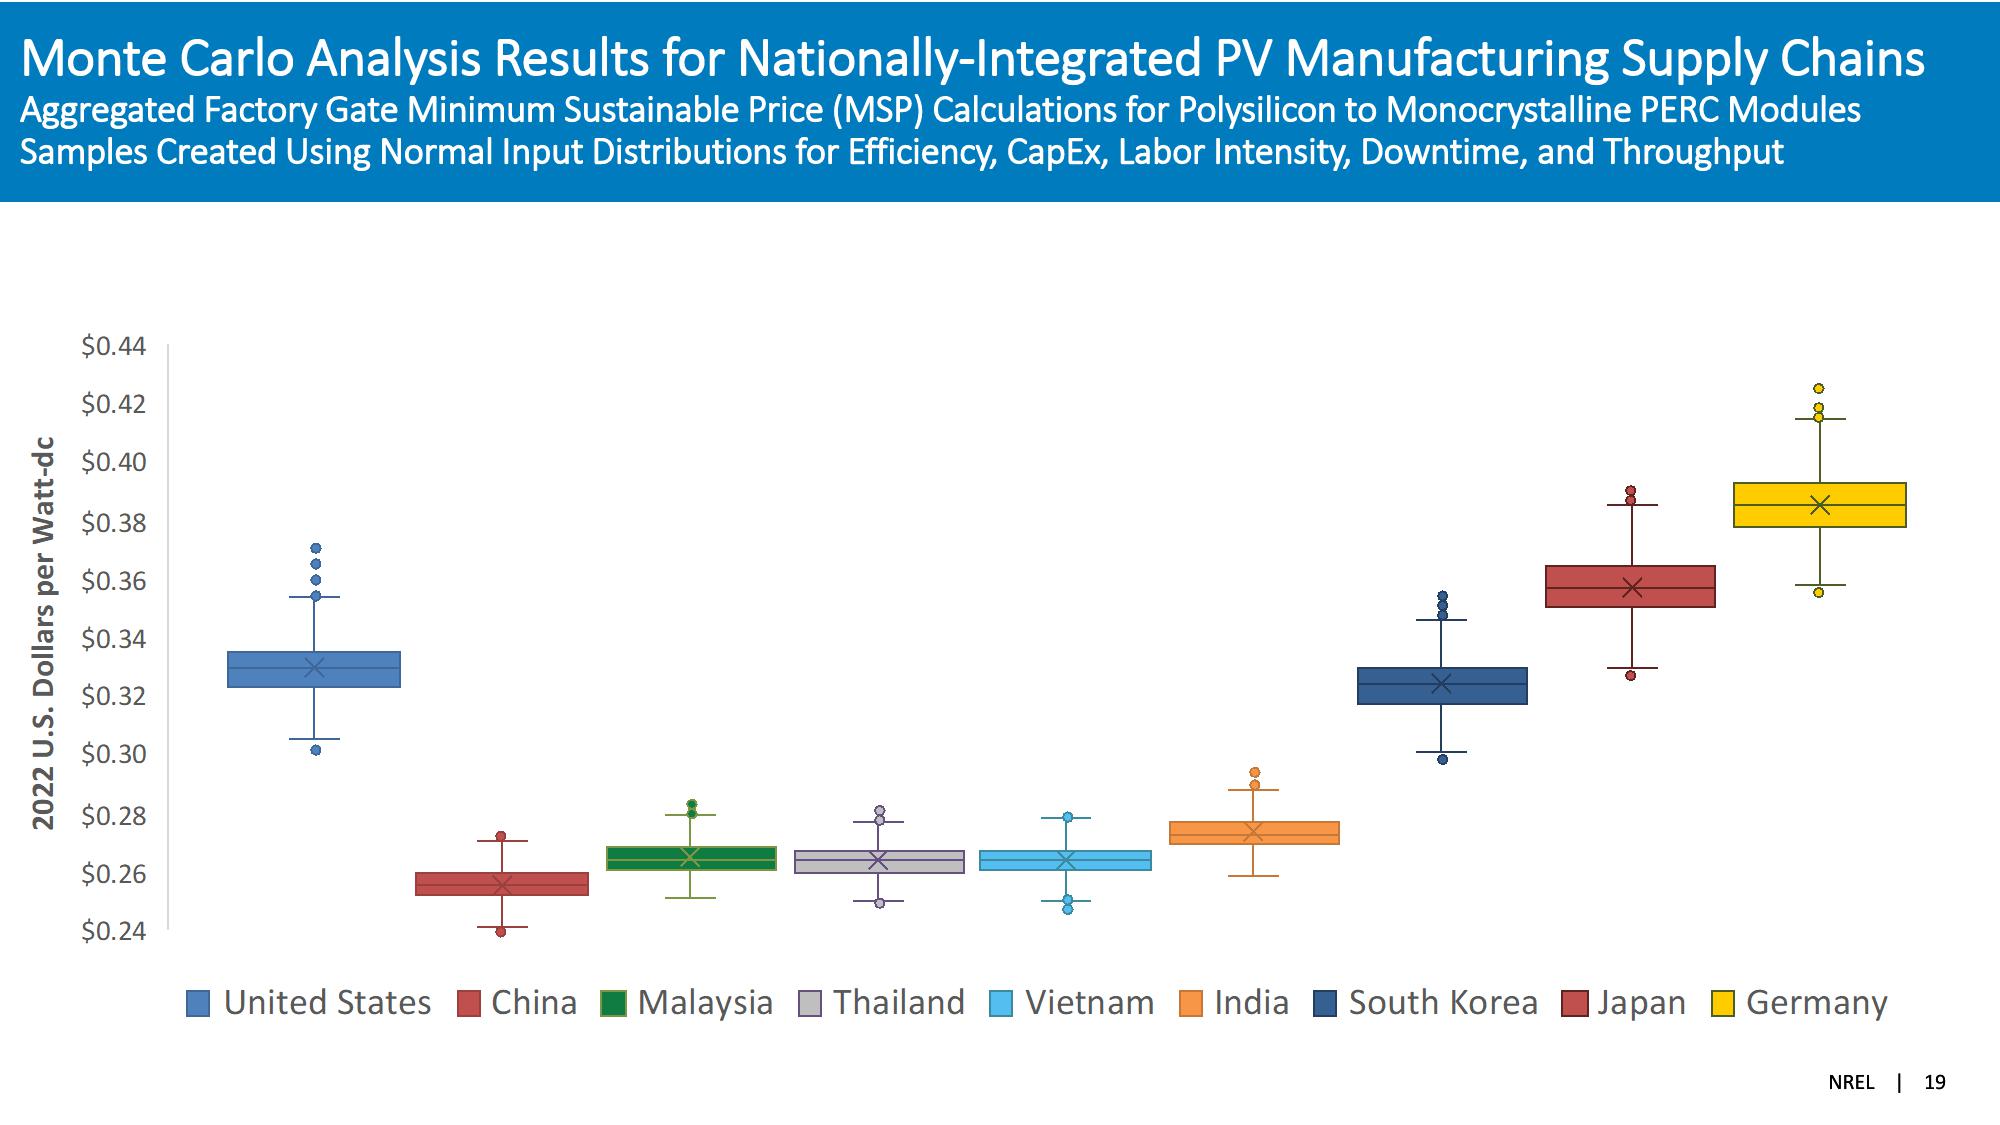
The Global Solar Photovoltaic Supply Chain and Bottom-UP Cost Model Results
Categories
Finance PresentationsTechnology PresentationsBanking PresentationsInformation Technology PresentationsOil and Energy PresentationsInternet PresentationsMining and Metals PresentationsCommunications PresentationsReal Estate PresentationsBiotechnology PresentationsAutomotive PresentationsMedical PresentationsRetail PresentationsEnergy Presentations