Cadre Holdings IPO Presentation Deck
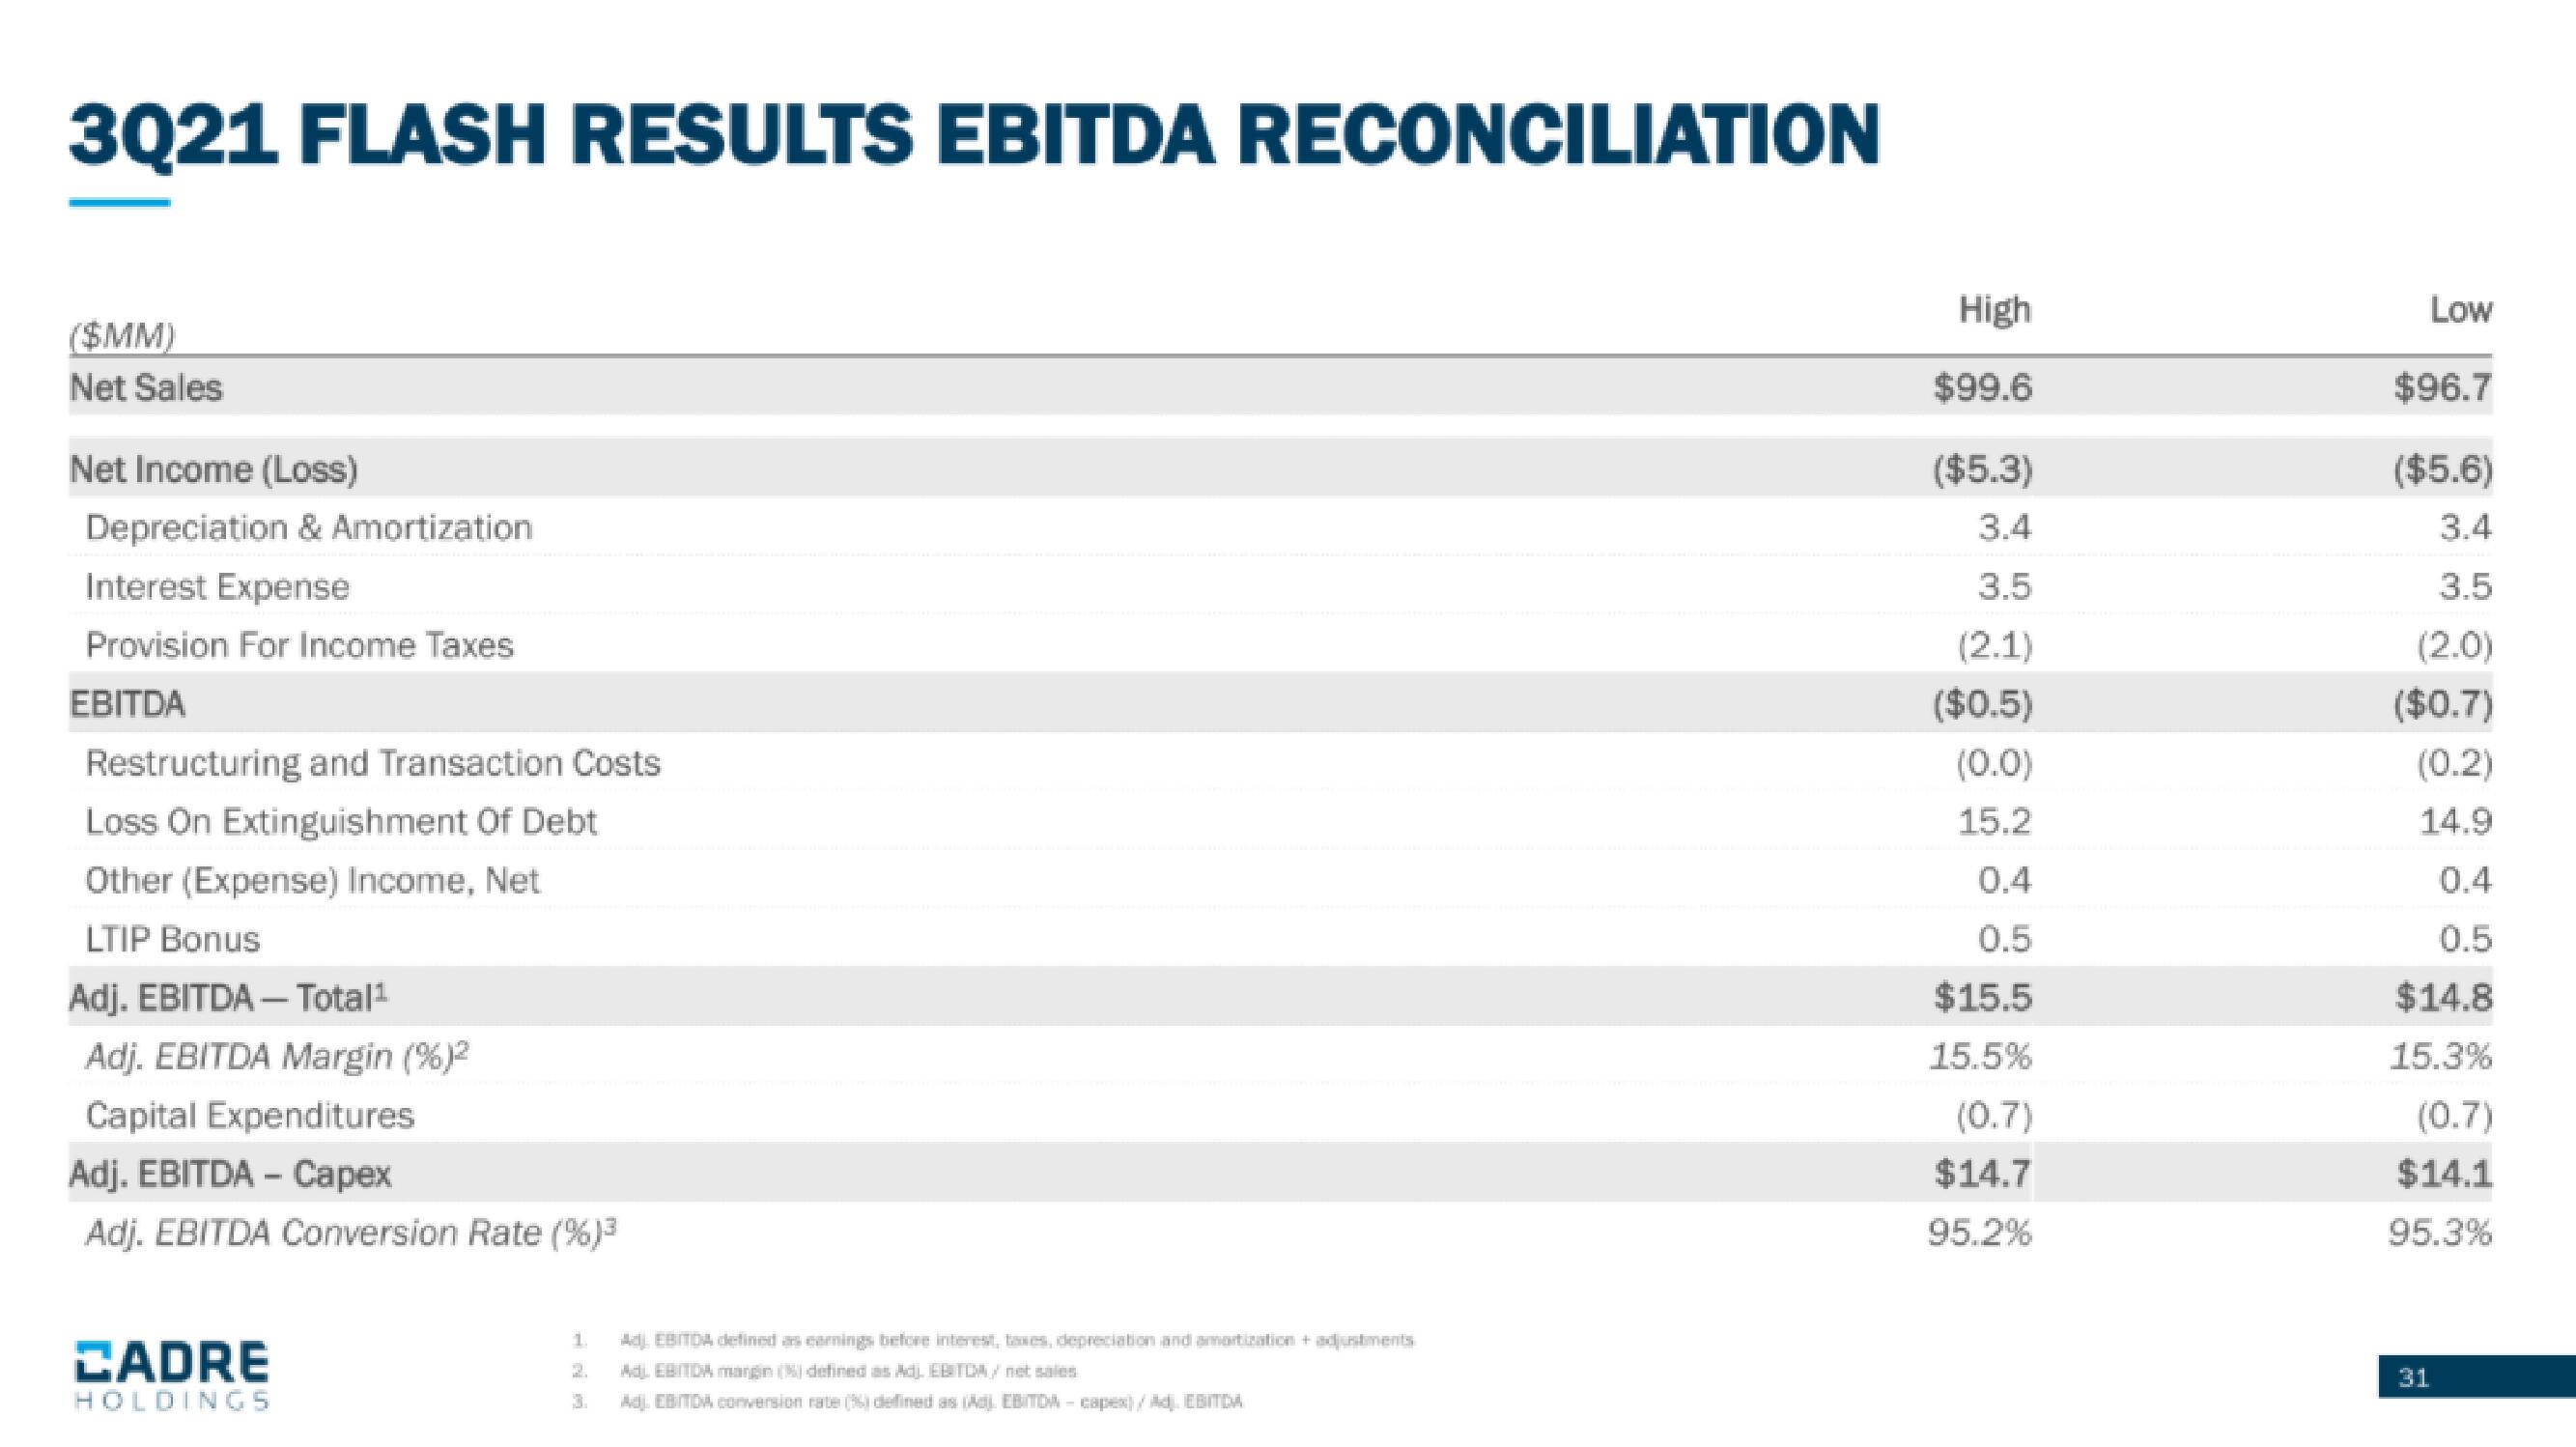
3021 FLASH RESULTS EBITDA RECONCILIATION
($MM)
Net Sales
Net Income (Loss)
Depreciation & Amortization
Interest Expense
Provision For Income Taxes
EBITDA
Restructuring and Transaction Costs
Loss On Extinguishment Of Debt
Other (Expense) Income, Net
LTIP Bonus
Adj. EBITDA - Total¹
Adj. EBITDA Margin (%)²
Capital Expenditures
Adj. EBITDA - Capex
Adj. EBITDA Conversion Rate (%)³
CADRE
HOLDINGS
1.
3.
Ad. EBITDA defined as earnings before interest, taxes, depreciation and amortization+ adjustments.
ADLEBITDA margin (X) defined as Adj. EBITDA / net sales
Adj. EBITDA conversion rate (6) defined as (Adj. EBITDA - capex) / Ad EBITDA
High
$99.6
($5.3)
3.4
3.5
(2.1)
($0.5)
(0.0)
15.2
0.4
0.5
$15.5
15.5%
(0.7)
$14.7
95.2%
Low
$96.7
($5.6)
3.4
3.5
(2.0)
($0.7)
(0.2)
14.9
0.4
0.5
$14.8
15.3%
(0.7)
$14.1
95.3%
31View entire presentation