Blend Investor Day Presentation Deck
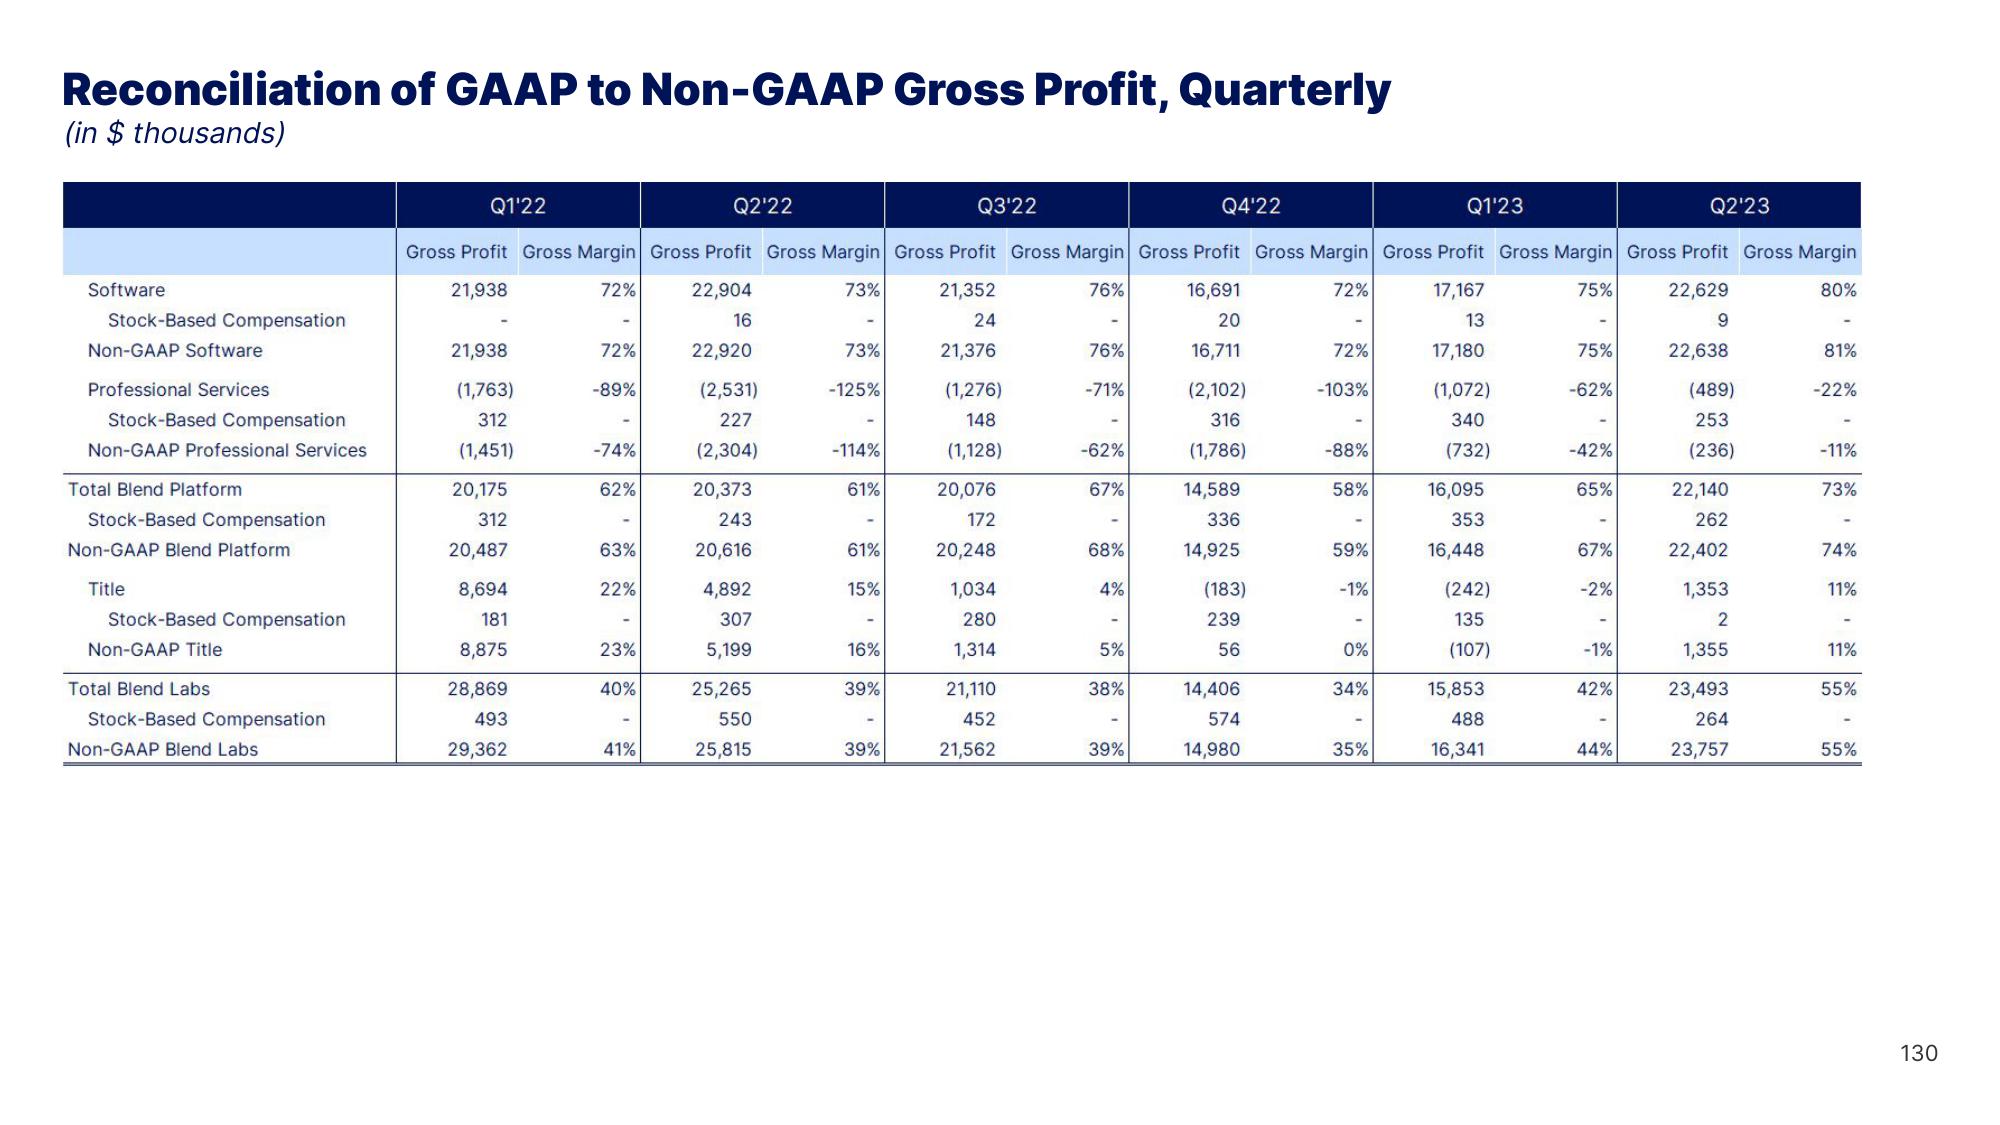
Reconciliation of GAAP to Non-GAAP Gross Profit, Quarterly
(in $ thousands)
Software
Stock-Based Compensation
Non-GAAP Software
Professional Services
Stock-Based Compensation
Non-GAAP Professional Services
Total Blend Platform
Stock-Based Compensation
Non-GAAP Blend Platform
Title
Stock-Based Compensation
Non-GAAP Title
Total Blend Labs
Stock-Based Compensation
Non-GAAP Blend Labs
Q1'22
21,938
(1,763)
312
(1,451)
20,175
312
20,487
8,694
181
8,875
28,869
493
29,362
72%
-89%
-74%
62%
Gross Profit Gross Margin Gross Profit Gross Margin Gross Profit Gross Margin Gross Profit Gross Margin Gross Profit Gross Margin Gross Profit Gross Margin
72%
21,938
73%
21,352
76%
72%
17,167
75%
22,629
80%
22,904
16
22,920
(2,531)
227
(2,304)
20,373
243
24
21,376
(1,276)
148
(1,128)
20,076
172
20,248
1,034
16,691
20
16,711
(2,102)
316
(1,786)
14,589
336
14,925
(183)
239
9
22,638
(489)
253
(236)
22,140
13
17,180
(1,072)
340
(732)
16,095
353
16,448
(242)
135
(107)
15,853
488
16,341
262
22,402
20,616
4,892
307
56
5,199
25,265
550
25,815
280
1,314
21,110
452
21,562
63%
22%
23%
40%
Q2'22
41%
73%
-125%
-114%
61%
61%
15%
16%
39%
Q3'22
39%
76%
-71%
-62%
67%
68%
4%
5%
38%
Q4'22
39%
14,406
574
14,980
72%
-103%
-88%
58%
59%
-1%
0%
34%
-
Q1'23
35%
75%
-62%
-42%
65%
67%
-2%
-1%
42%
Q2'23
44%
1,353
2
1,355
23,493
264
23,757
81%
-22%
-11%
73%
74%
11%
11%
55%
55%
130View entire presentation