Maersk Investor Presentation Deck
Highlights Q4 2020
Ocean
●
●
●
13
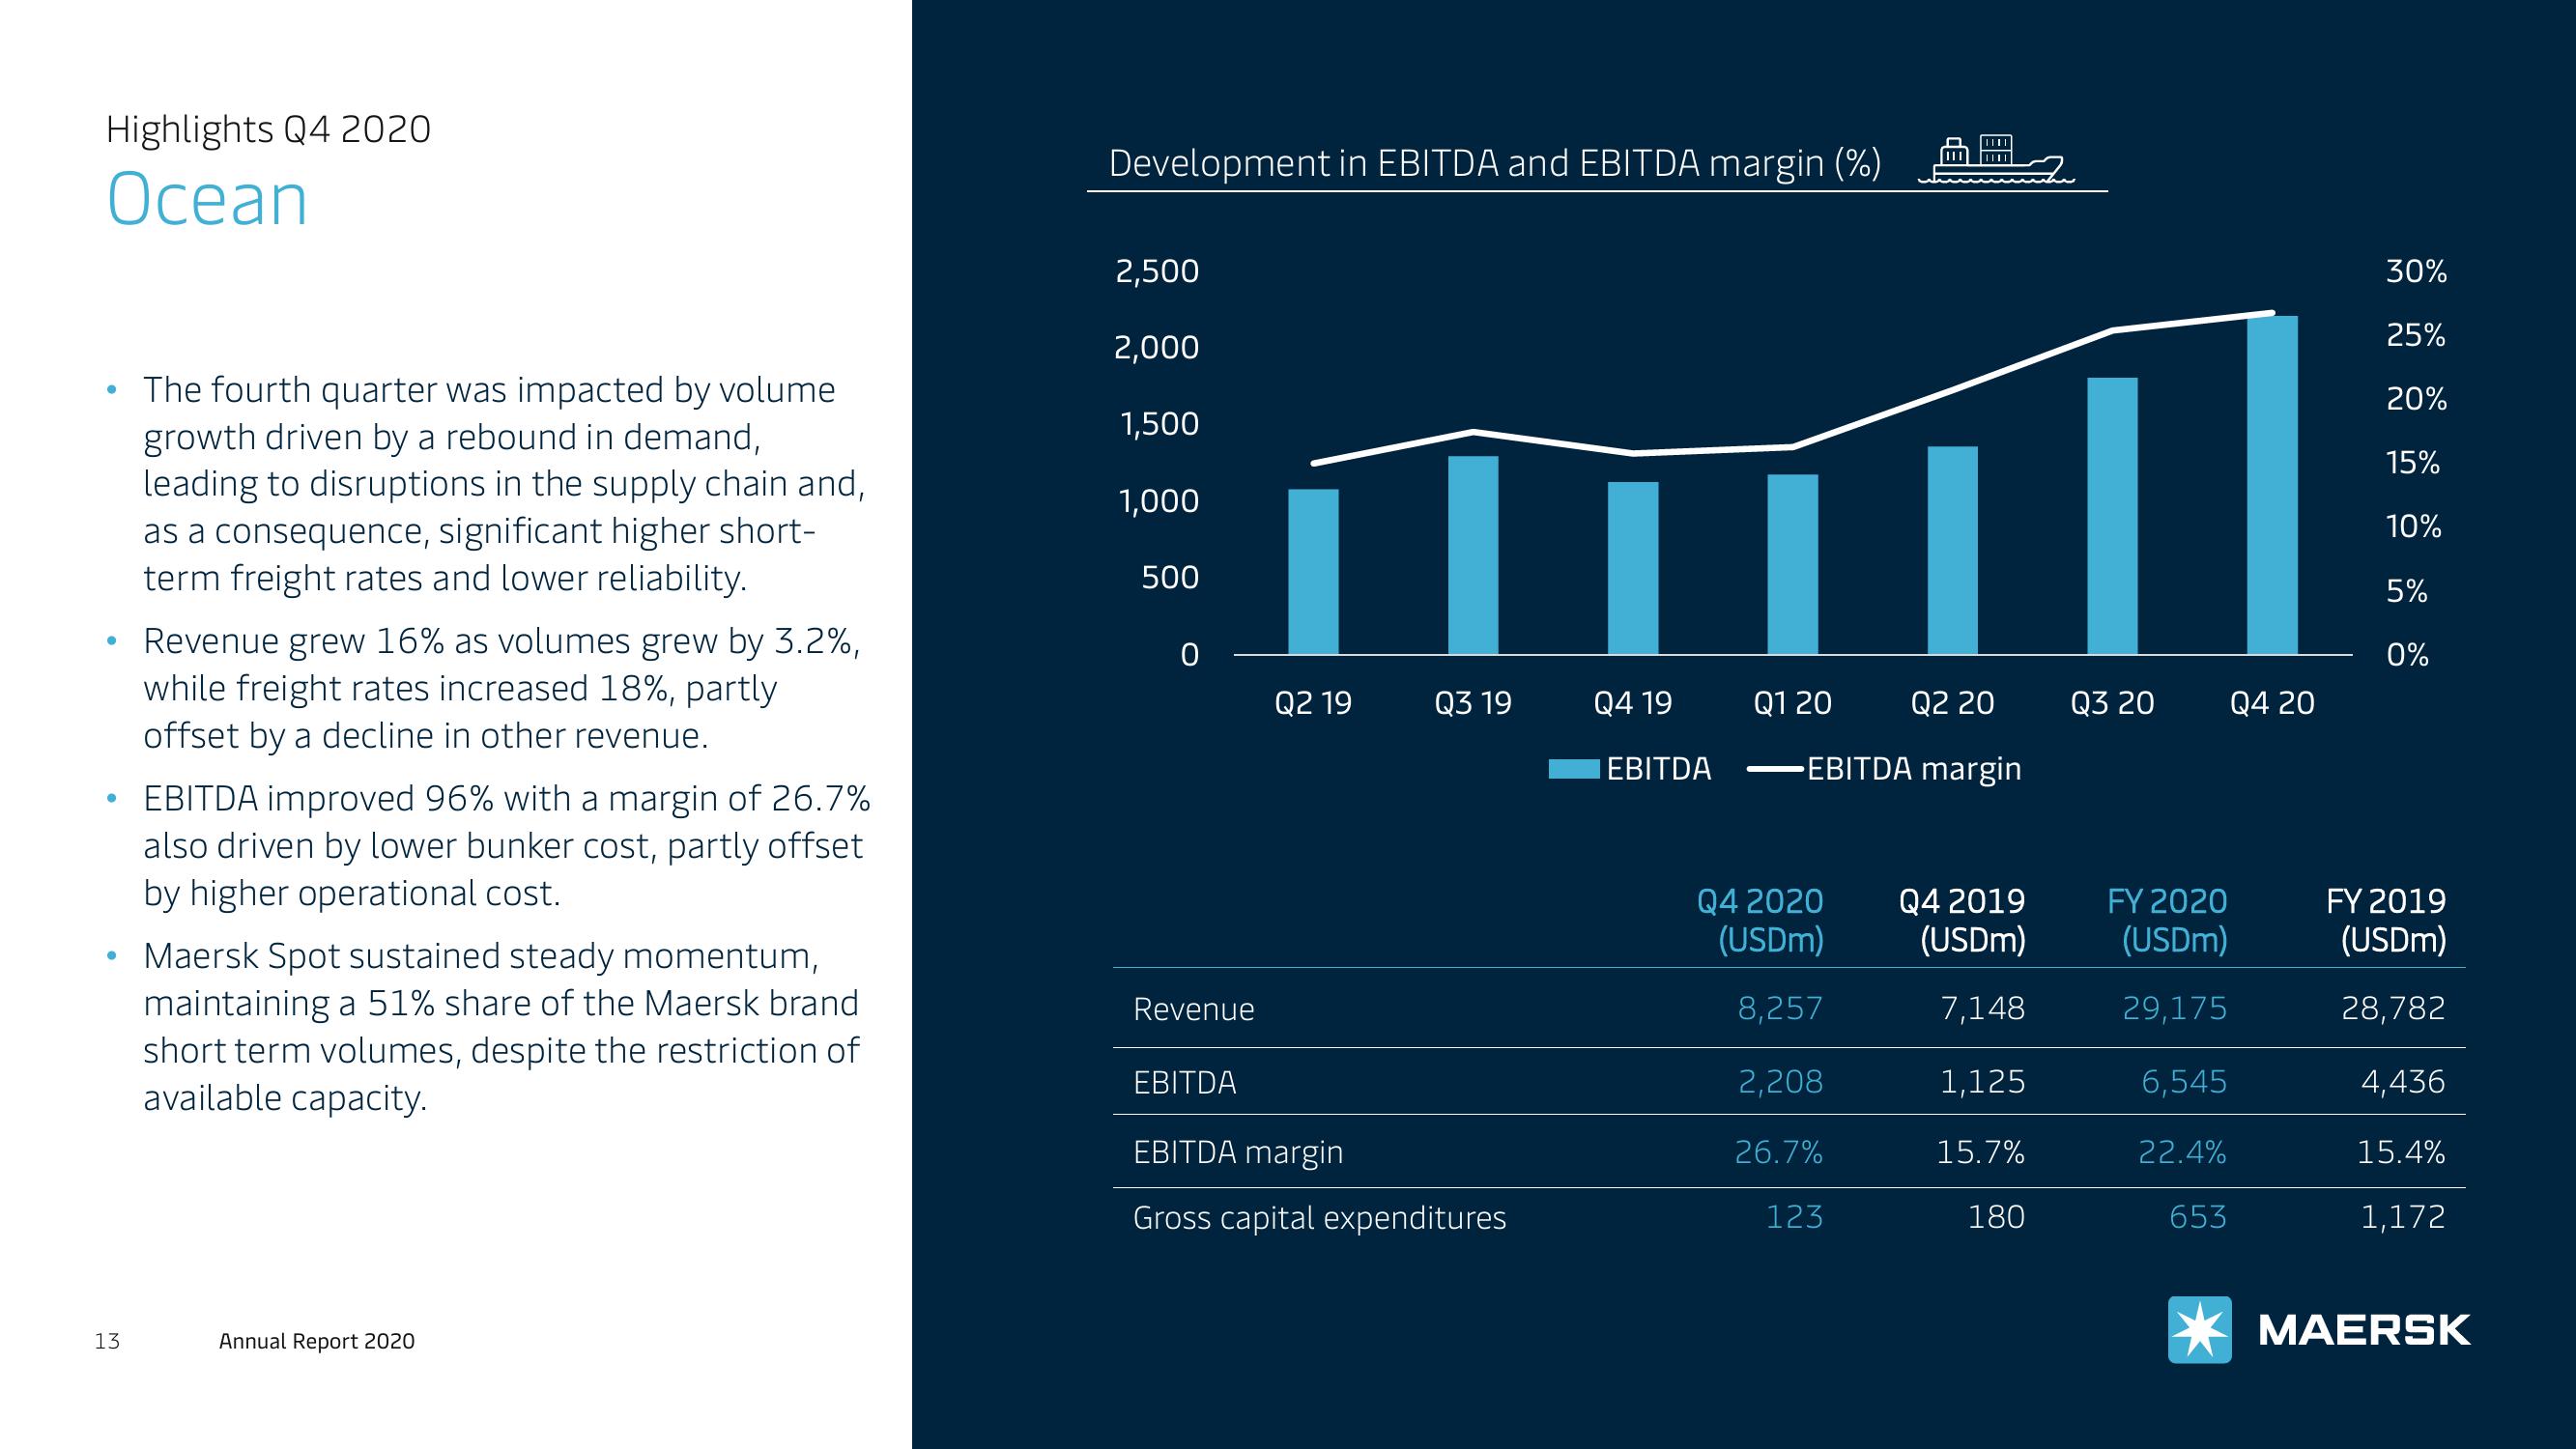
The fourth quarter was impacted by volume
growth driven by a rebound in demand,
leading to disruptions in the supply chain and,
as a consequence, significant higher short-
term freight rates and lower reliability.
Revenue grew 16% as volumes grew by 3.2%,
while freight rates increased 18%, partly
offset by a decline in other revenue.
EBITDA improved 96% with a margin of 26.7%
also driven by lower bunker cost, partly offset
by higher operational cost.
Maersk Spot sustained steady momentum,
maintaining a 51% share of the Maersk brand
short term volumes, despite the restriction of
available capacity.
Annual Report 2020
Development in EBITDA and EBITDA margin (%)
2,500
2,000
1,500
1,000
500
0
Revenue
Q2 19
Q3 19
EBITDA
EBITDA margin
Gross capital expenditures
||
Q4 19
EBITDA
Q2 20
EBITDA margin
Q1 20
Q4 2020
(USDM)
8,257
2,208
26.7%
123
Q4 2019
(USDm)
7,148
1,125
15.7%
180
Q3 20
FY 2020
(USDM)
29,175
6,545
22.4%
653
Q4 20
30%
25%
20%
15%
10%
5%
0%
FY 2019
(USDm)
28,782
4,436
15.4%
1,172
MAERSKView entire presentation