Grindr SPAC Presentation Deck
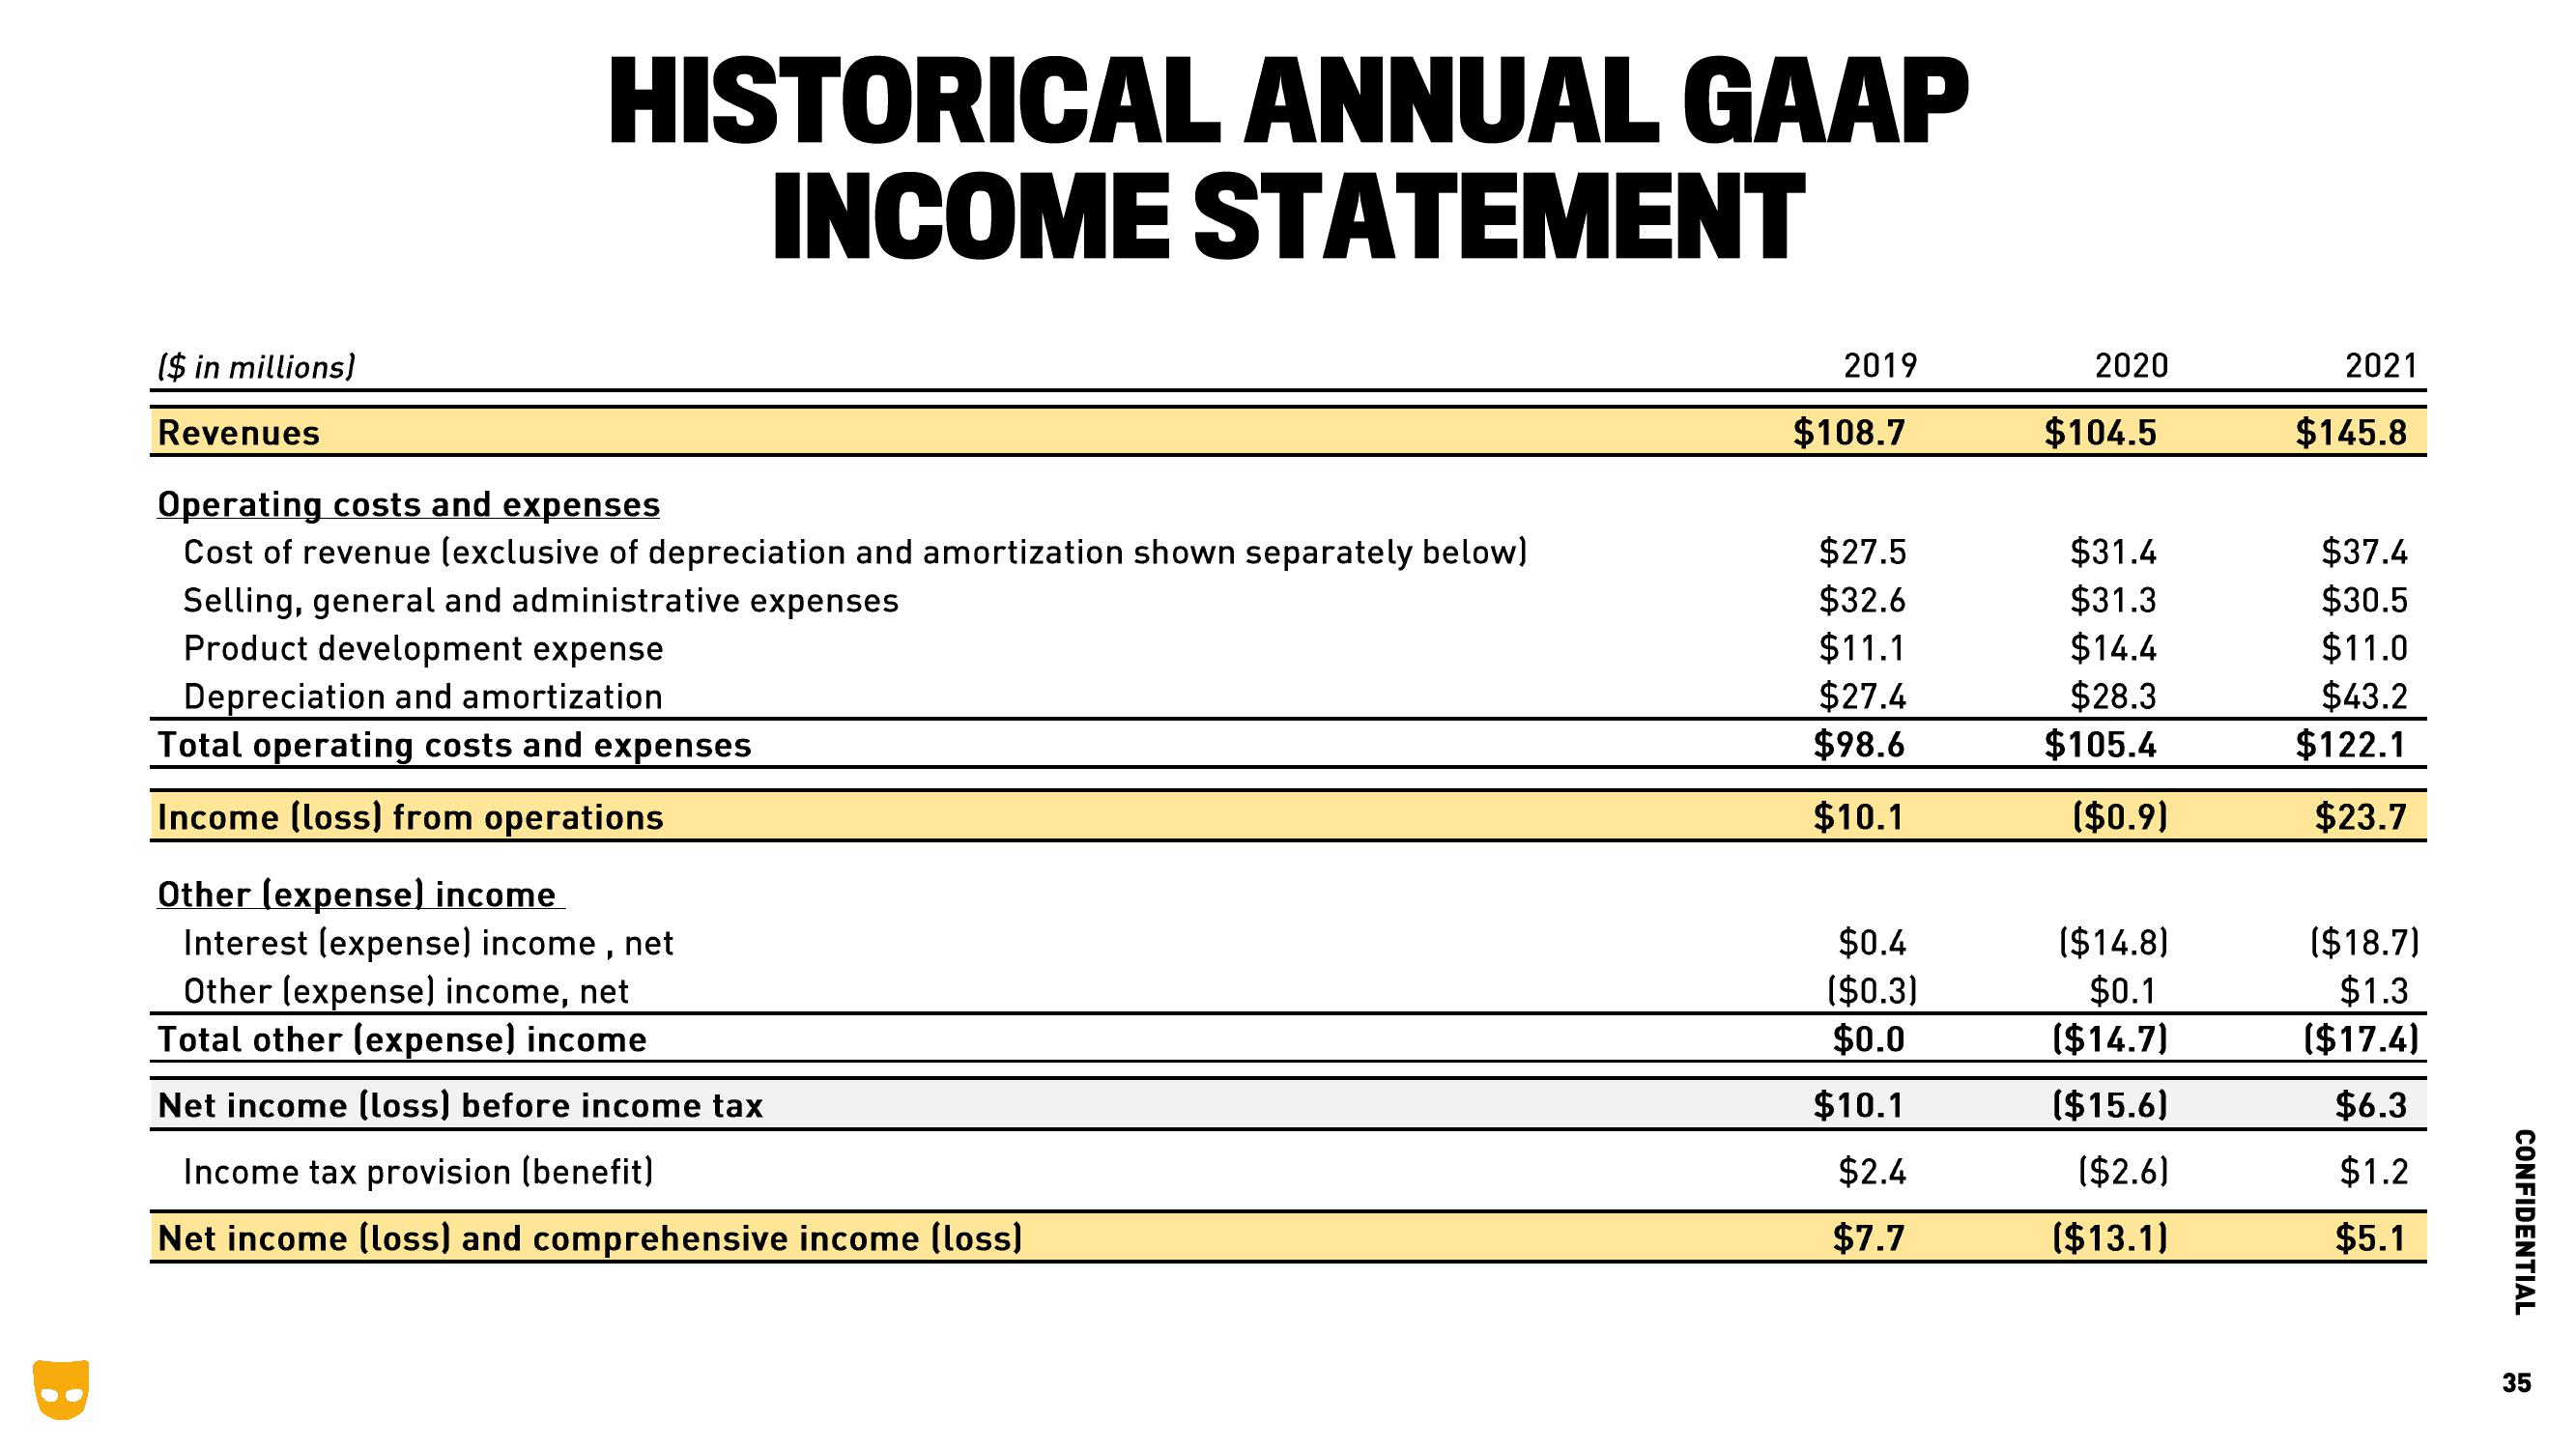
HISTORICAL ANNUAL GAAP
INCOME STATEMENT
($ in millions)
Revenues
Operating costs and expenses
Cost of revenue (exclusive of depreciation and amortization shown separately below)
Selling, general and administrative expenses
Product development expense
Depreciation and amortization
Total operating costs and expenses
Income (loss) from operations
Other (expense) income
Interest (expense) income, net
Other (expense) income, net
Total other (expense) income
Net income (loss) before income tax
Income tax provision (benefit)
Net income (loss) and comprehensive income (loss)
2019
$108.7
$27.5
$32.6
$11.1
$27.4
$98.6
$10.1
$0.4
($0.3)
$0.0
$10.1
$2.4
$7.7
2020
$104.5
$31.4
$31.3
$14.4
$28.3
$105.4
($0.9)
($14.8)
$0.1
($14.7)
($15.6)
($2.6)
($13.1)
2021
$145.8
$37.4
$30.5
$11.0
$43.2
$122.1
$23.7
($18.7)
$1.3
($17.4)
$6.3
$1.2
$5.1
CONFIDENTIAL
35View entire presentation