Moelis & Company Investor Presentation Deck
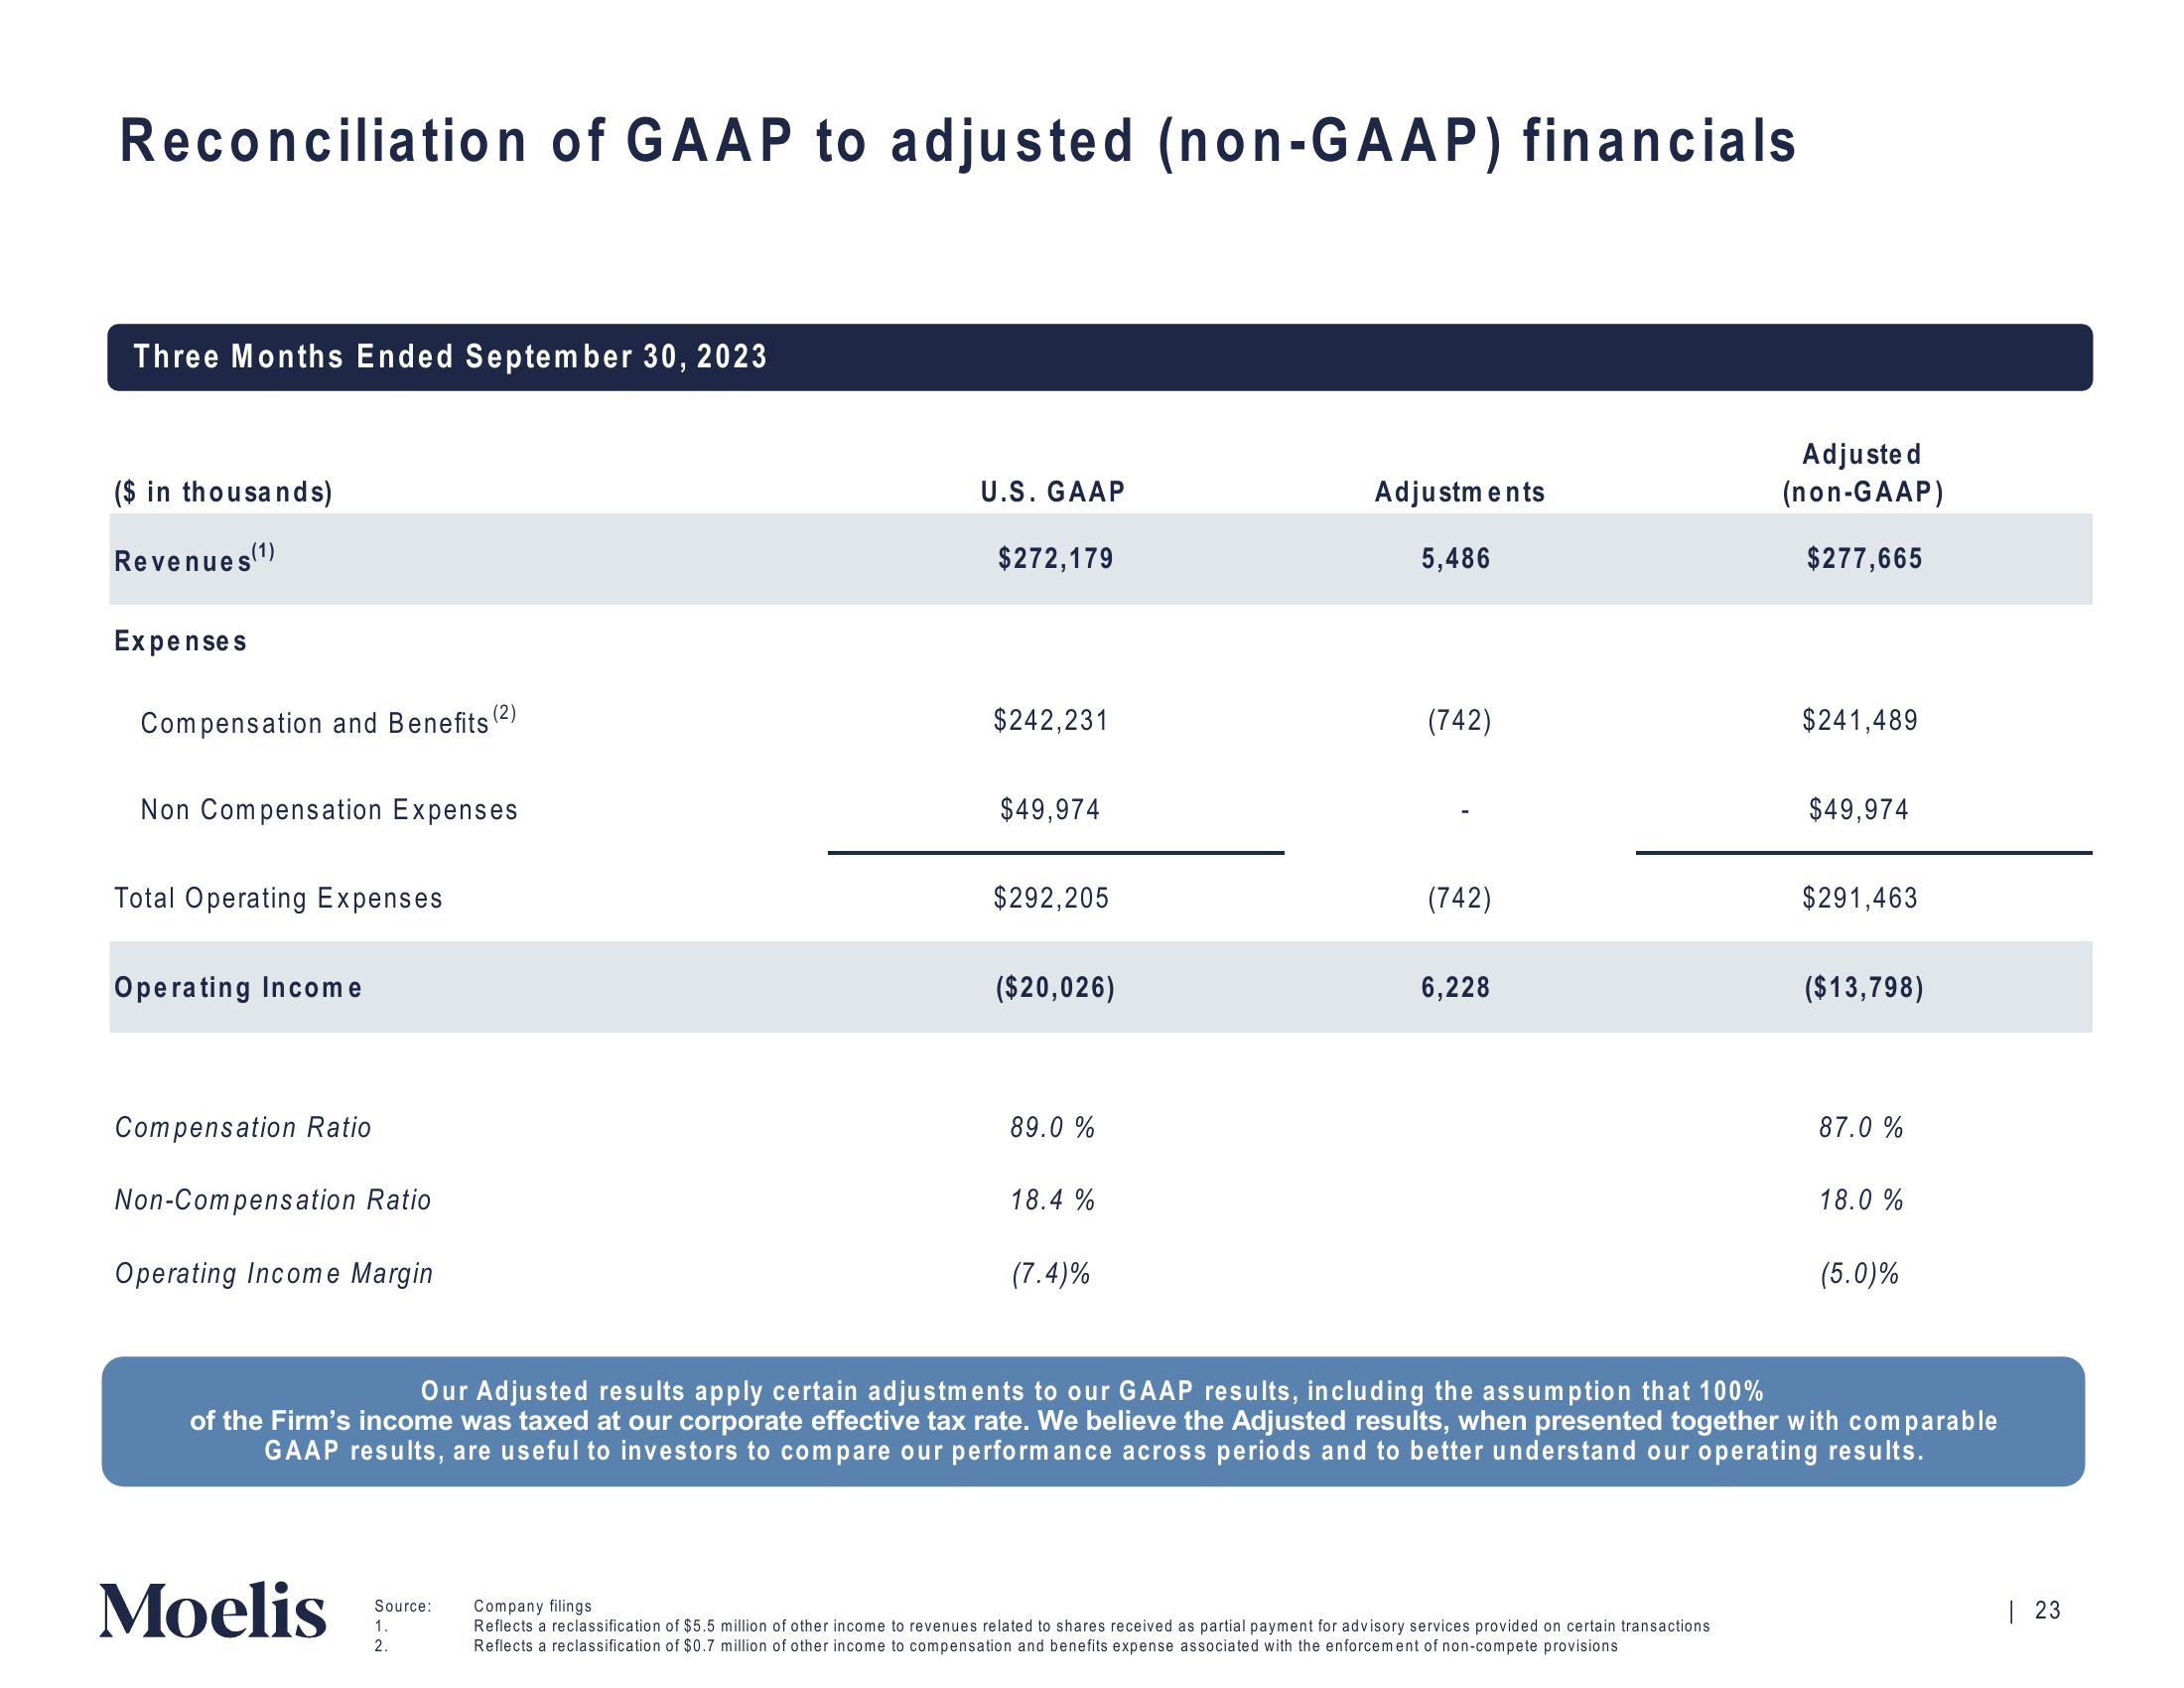
Reconciliation of GAAP to adjusted (non-GAAP) financials
Three Months Ended September 30, 2023
($ in thousands)
Revenues (¹)
Expenses
Compensation and Benefits
Non Compensation Expenses
Total Operating Expenses
Operating Income
Compensation Ratio
Non-Compensation Ratio
Operating Income Margin
(2)
Moelis
Source:
1.
2.
U.S. GAAP
$272,179
$242,231
$49,974
$292,205
($20,026)
89.0 %
18.4%
(7.4)%
Adjustments
5,486
(742)
(742)
6,228
Adjuste d
(non-GAAP)
$277,665
Company filings
Reflects a reclassification of $5.5 million of other income to revenues related to shares received as partial payment for advisory services provided on certain transactions
Reflects a reclassification of $0.7 million of other income to compensation and benefits expense associated with the enforcement of non-compete provisions
$241,489
$49,974
$291,463
($13,798)
87.0 %
Our Adjusted results apply certain adjustments to our GAAP results, including the assumption that 100%
of the Firm's income was taxed at our corporate effective tax rate. We believe the Adjusted results, when presented together with comparable
GAAP results, are useful to investors to compare our performance across periods and to better understand our operating results.
18.0%
(5.0)%
| 23View entire presentation