Lazard Investor Presentation Deck
INVESTOR PRESENTATION
Our Performance
Diversified
Revenue Growth
Total Operating Revenue ($M)
$2,344
44%
55%
$2,655
47%
$2,755
45%
52% 55%
$2,546 $2,524
LAZARD
46% 44%
53% 56%
$3,139
42%
$2,769
40%
57% 60%
2016 2017 2018 2019 2020 2021 2022
Financial Advisory Asset Management Corporate
Disciplined
Operating Margin, as Adjusted
25%
25% Average
27% 27%
23% 23%
26%
21%
2016 2017 2018 2019 2020 2021 2022
■Consolidated Operating Margin, as adjusted
I
INVESTMENT HIGHLIGHTS
Profitable
Return of Capital
% Of Net Income, as Adjusted
$755
113% Average
$695
2016 2017 2018 2019 2020 2021 2022
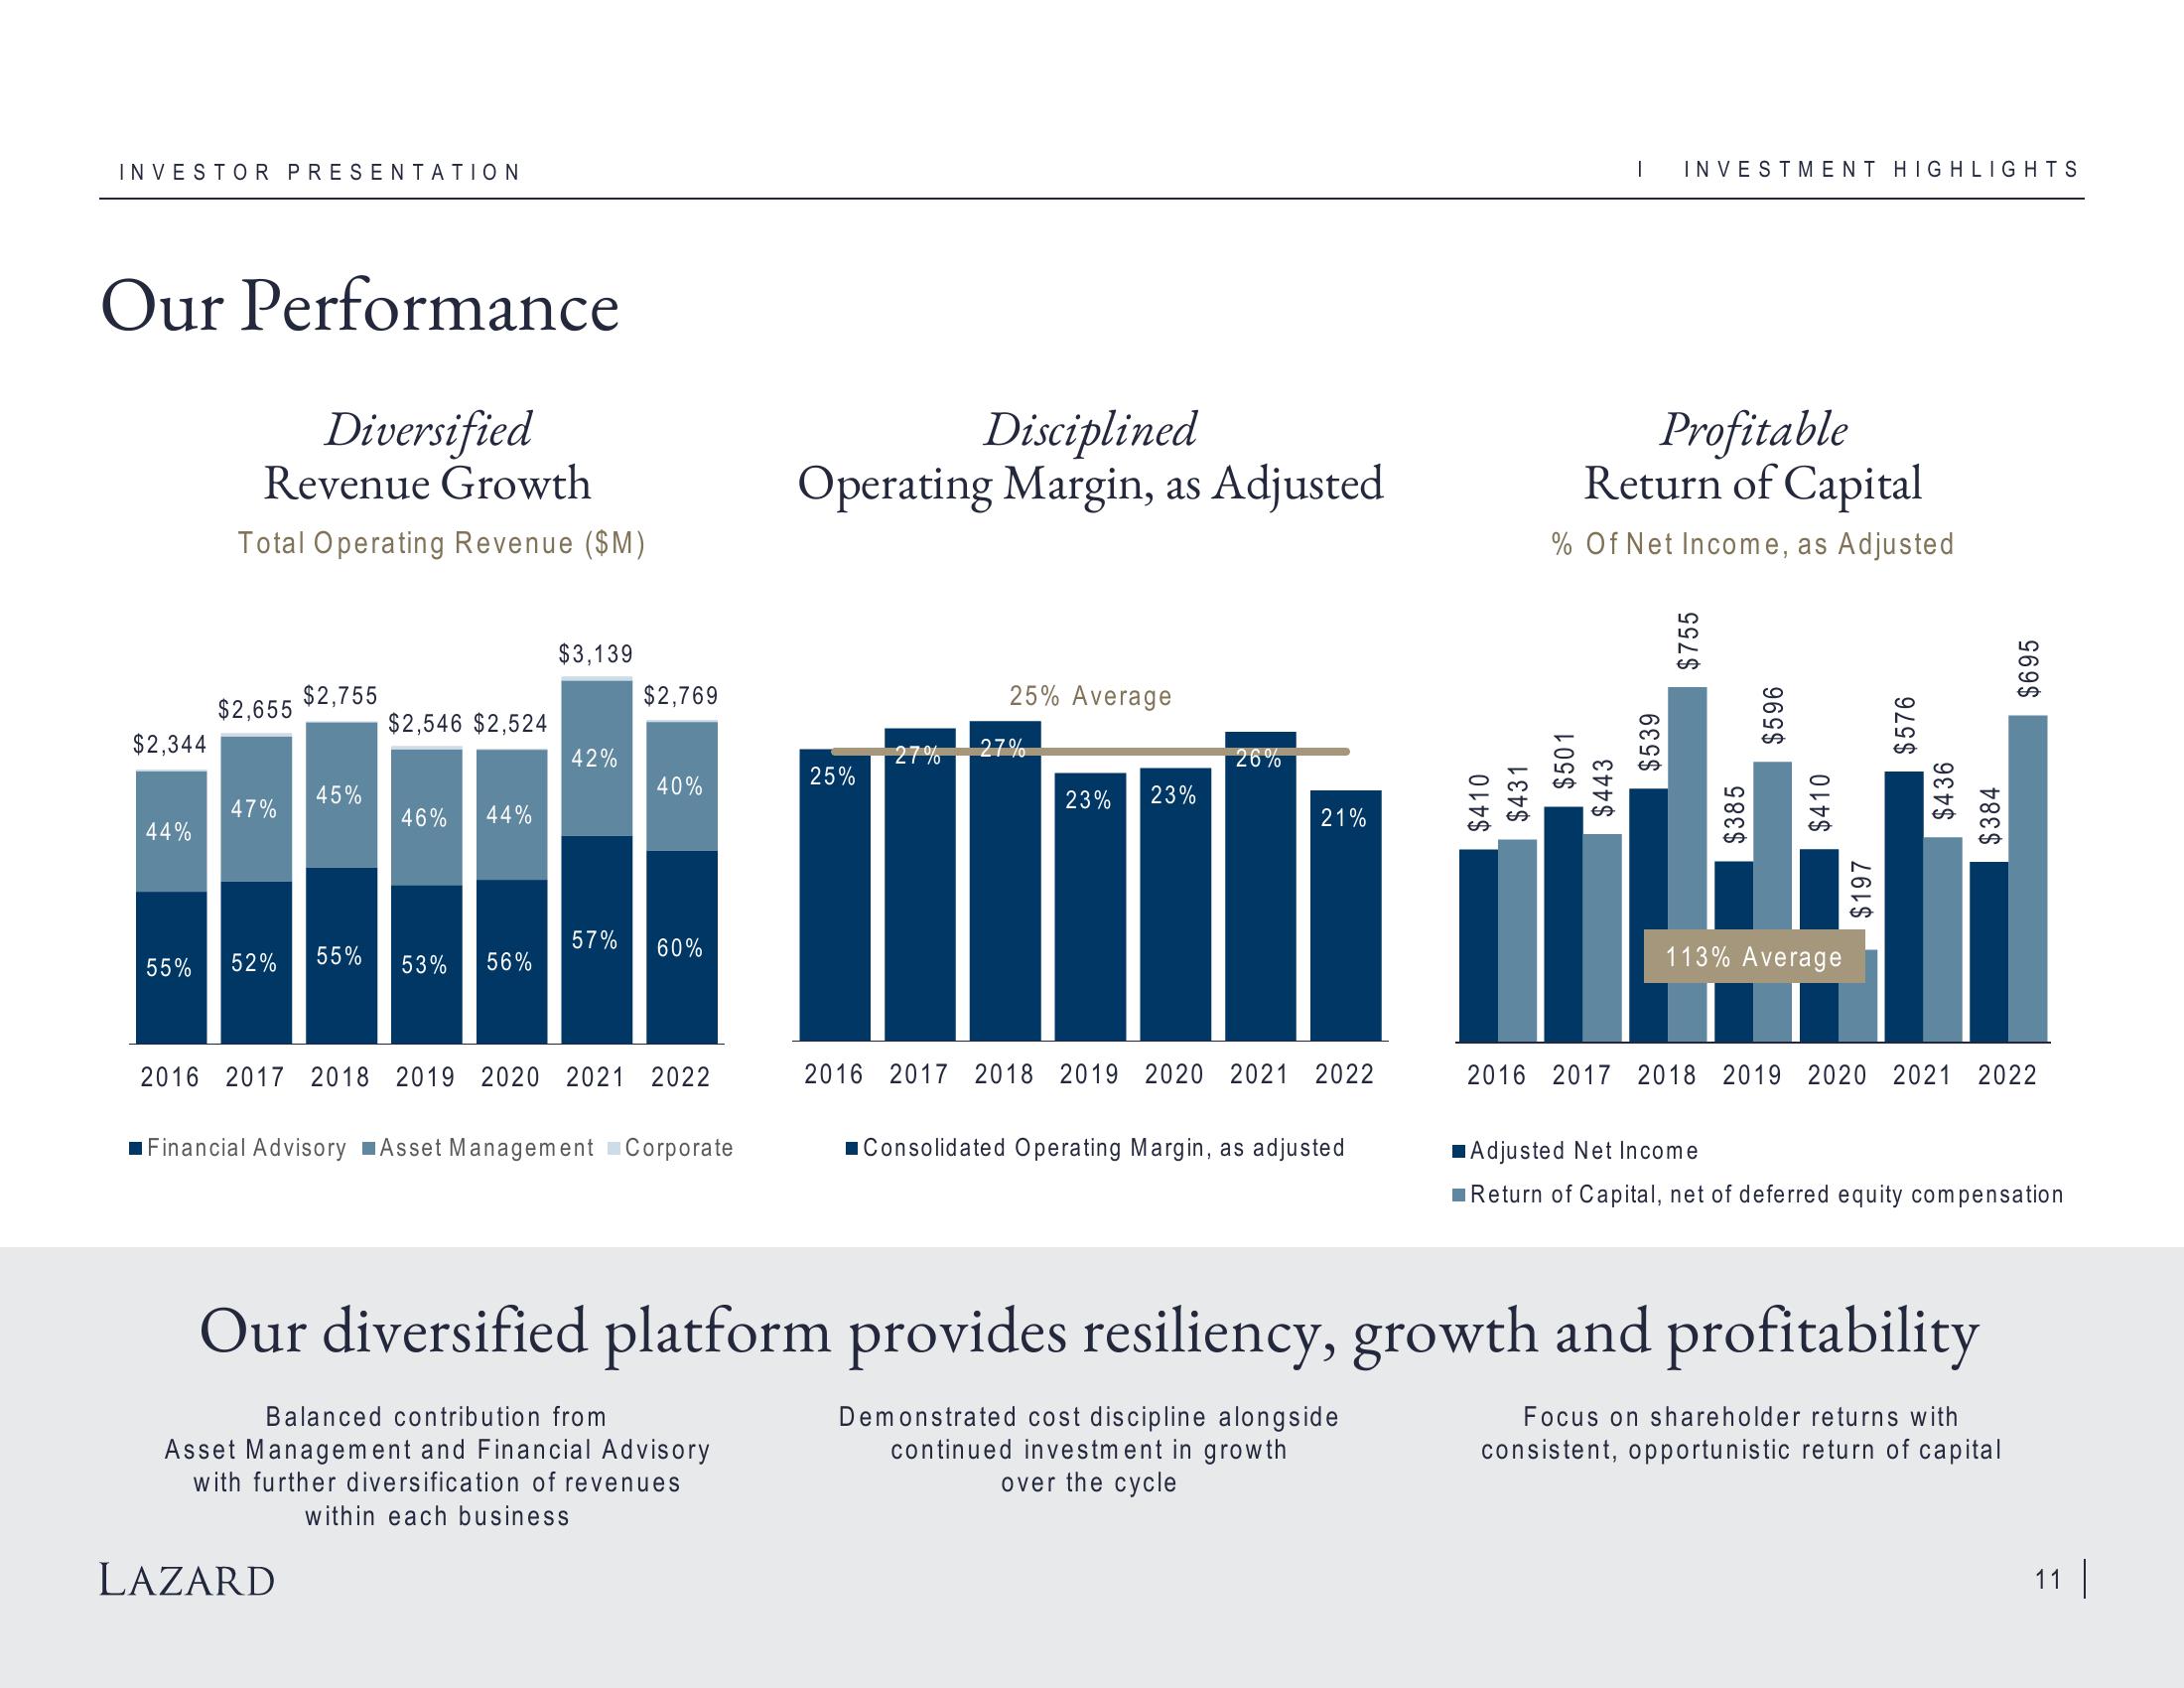
Our diversified platform provides resiliency, growth and profitability
Balanced contribution from
Asset Management and Financial Advisory
with further diversification of revenues
within each business
Demonstrated cost discipline alongside
continued investment in growth
over the cycle
Focus on shareholder returns with
consistent, opportunistic return of capital
Adjusted Net Income
Return of Capital, net of deferred equity compensation
11 |View entire presentation