Acast Results Presentation Deck slide image

Acast Results Presentation Deck

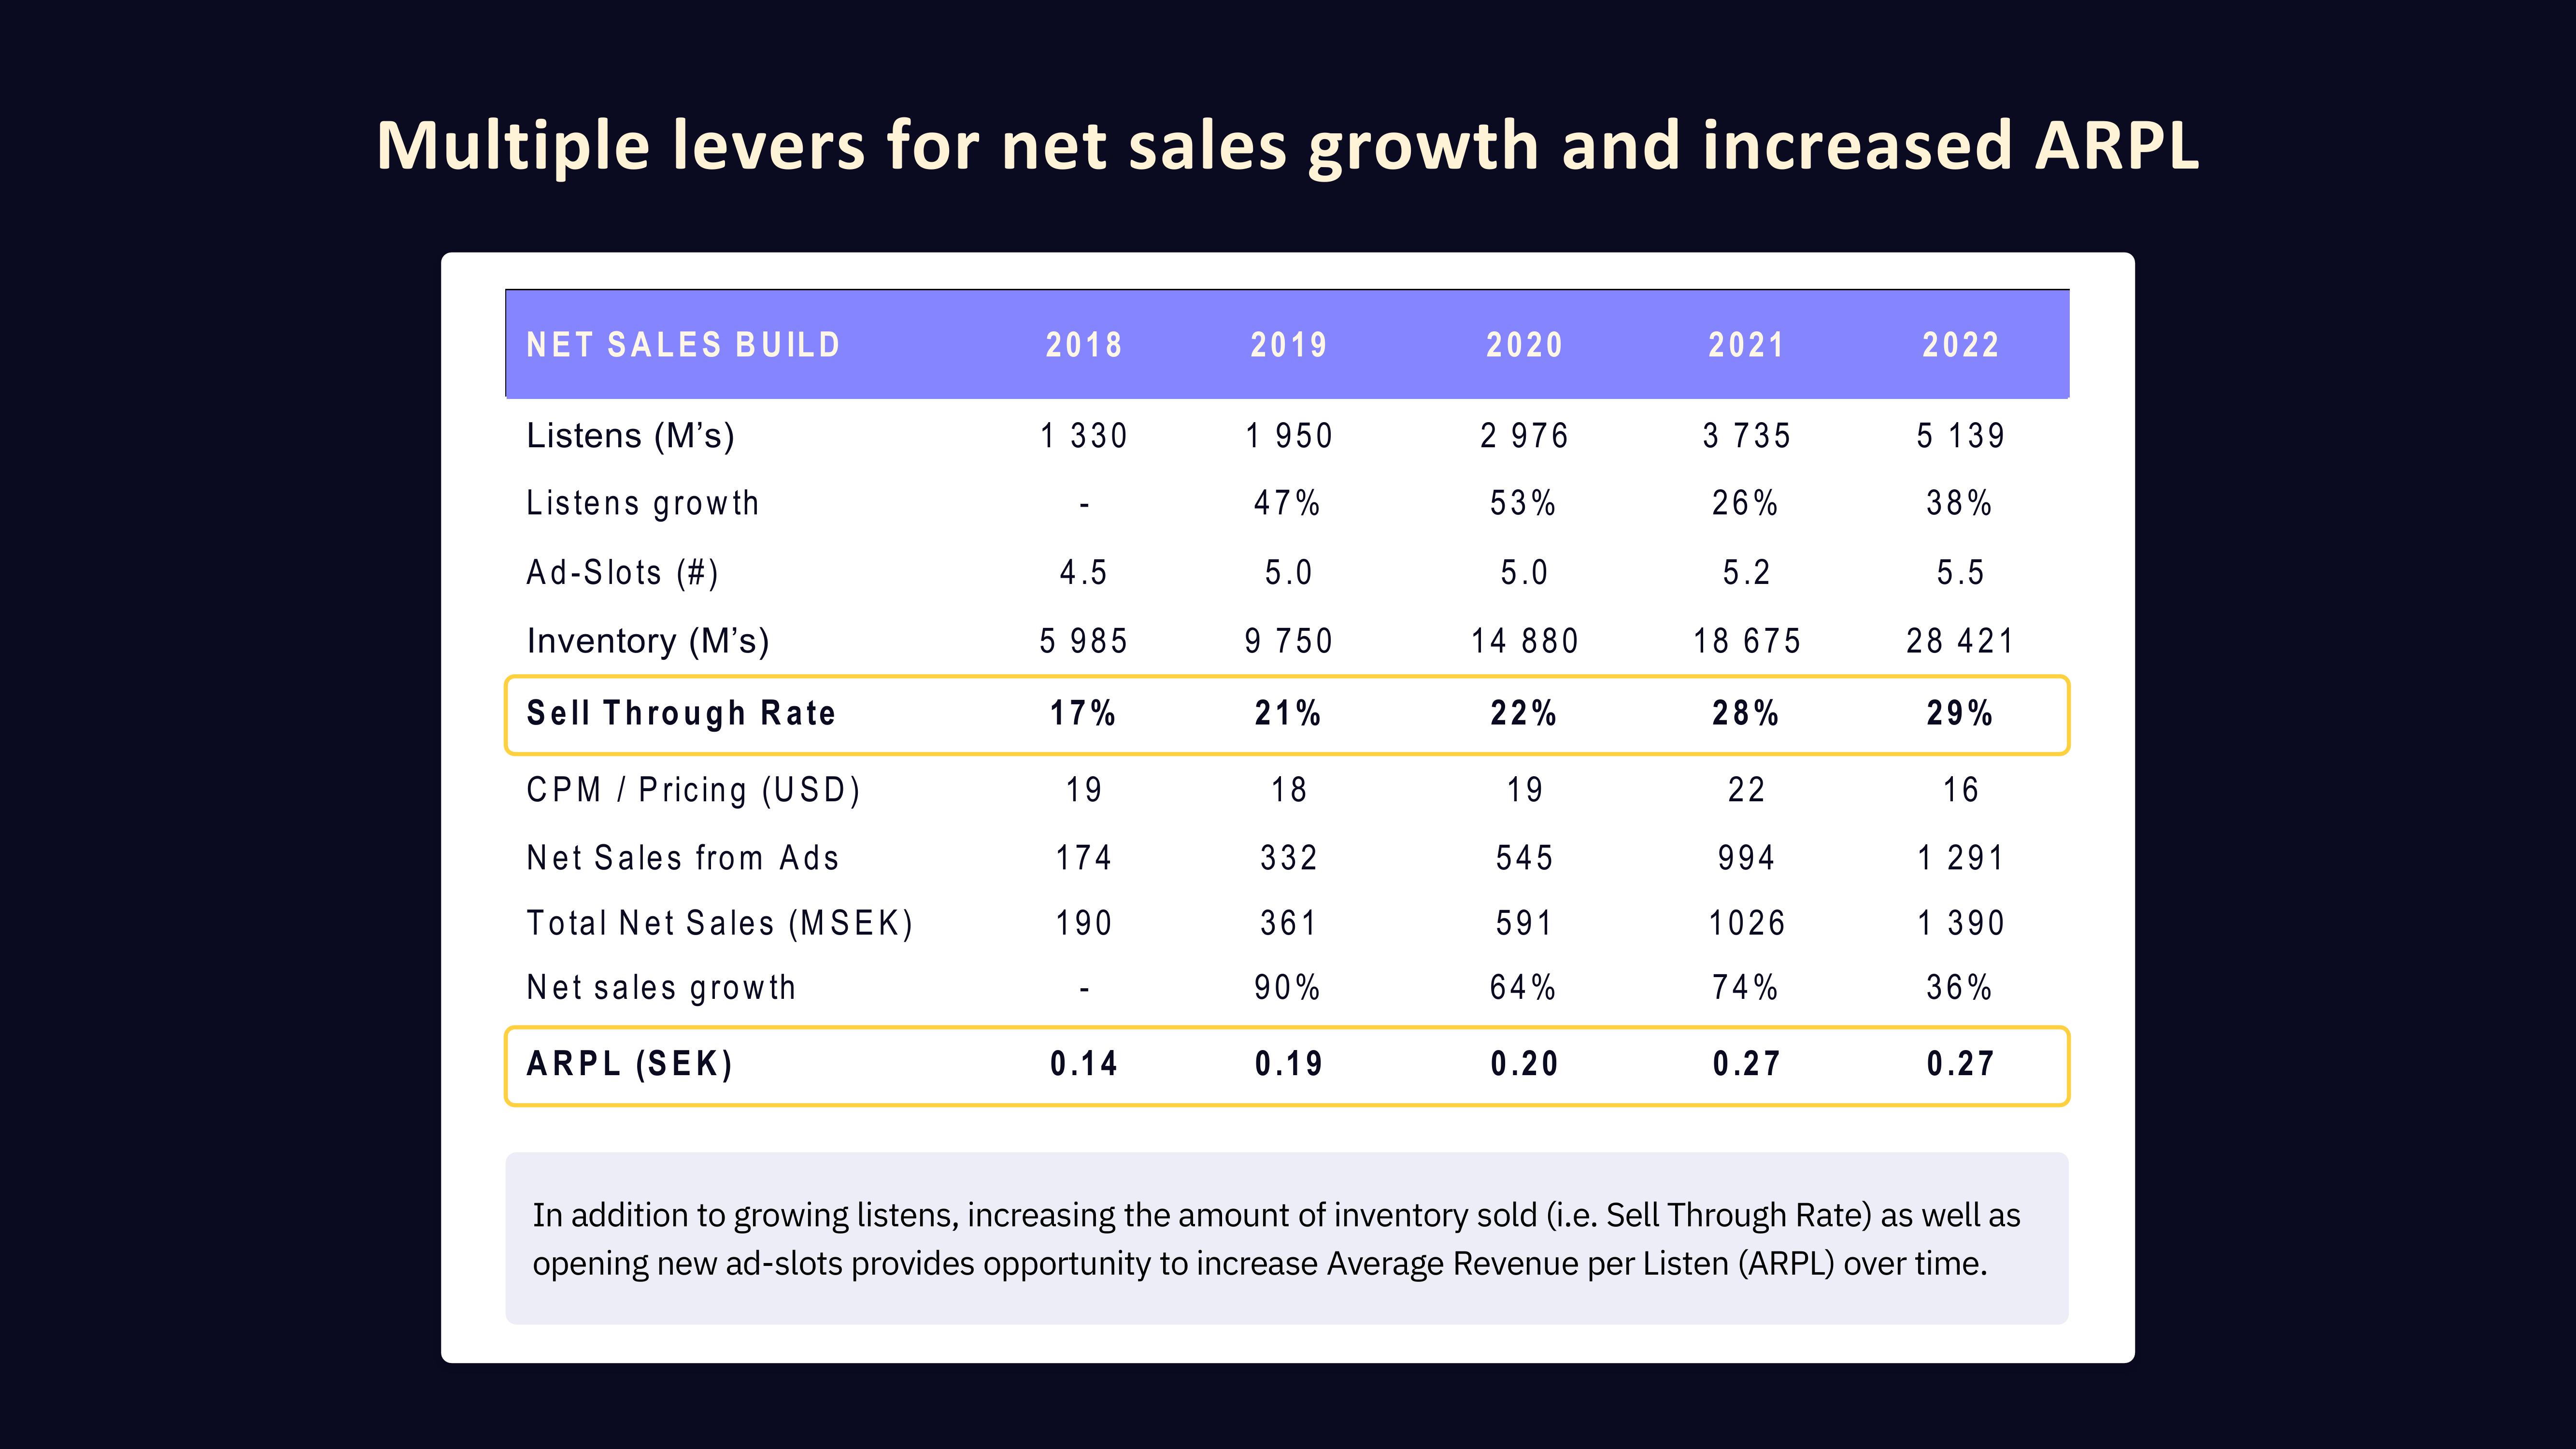
Multiple levers for net sales growth and increased ARPL NET SALES BUILD Listens (M's) Listens growth Ad-Slots (#) Inventory (M's) Sell Through Rate CPM Pricing (USD) Net Sales from Ads Total Net Sales (MSEK) Net sales growth ARPL (SEK) 2018 1 330 4.5 5 985 17% 19 174 190 0.14 2019 1 950 47% 5.0 9 750 21% 18 332 361 90% 0.19 2020 2 976 53% 5.0 14 880 22% 19 545 591 64% 0.20 2021 3 735 26% 5.2 18 675 28% 22 994 1026 74% 0.27 2022 5 139 38% 5.5 28 421 29% 16 1 291 1 390 36% 0.27 In addition to growing listens, increasing the amount of inventory sold (i.e. Sell Through Rate) as well as opening new ad-slots provides opportunity to increase Average Revenue per Listen (ARPL) over time.
View entire presentation