Oatly Results Presentation Deck
Production
volume(1)
Sales
volume(1)
106
95
$146
20 2022 FINANCIALS OVERVIEW
TOPLINE MOMENTUM EXPECTED TO FURTHER ACCELERATE IN 2H22 AS CAPACITY INCREASES
REVENUE
GROSS PROFIT
ADJ. EBITDA (3)
CAPEX
20 2021
+22%
124
121
$178
2Q 2022
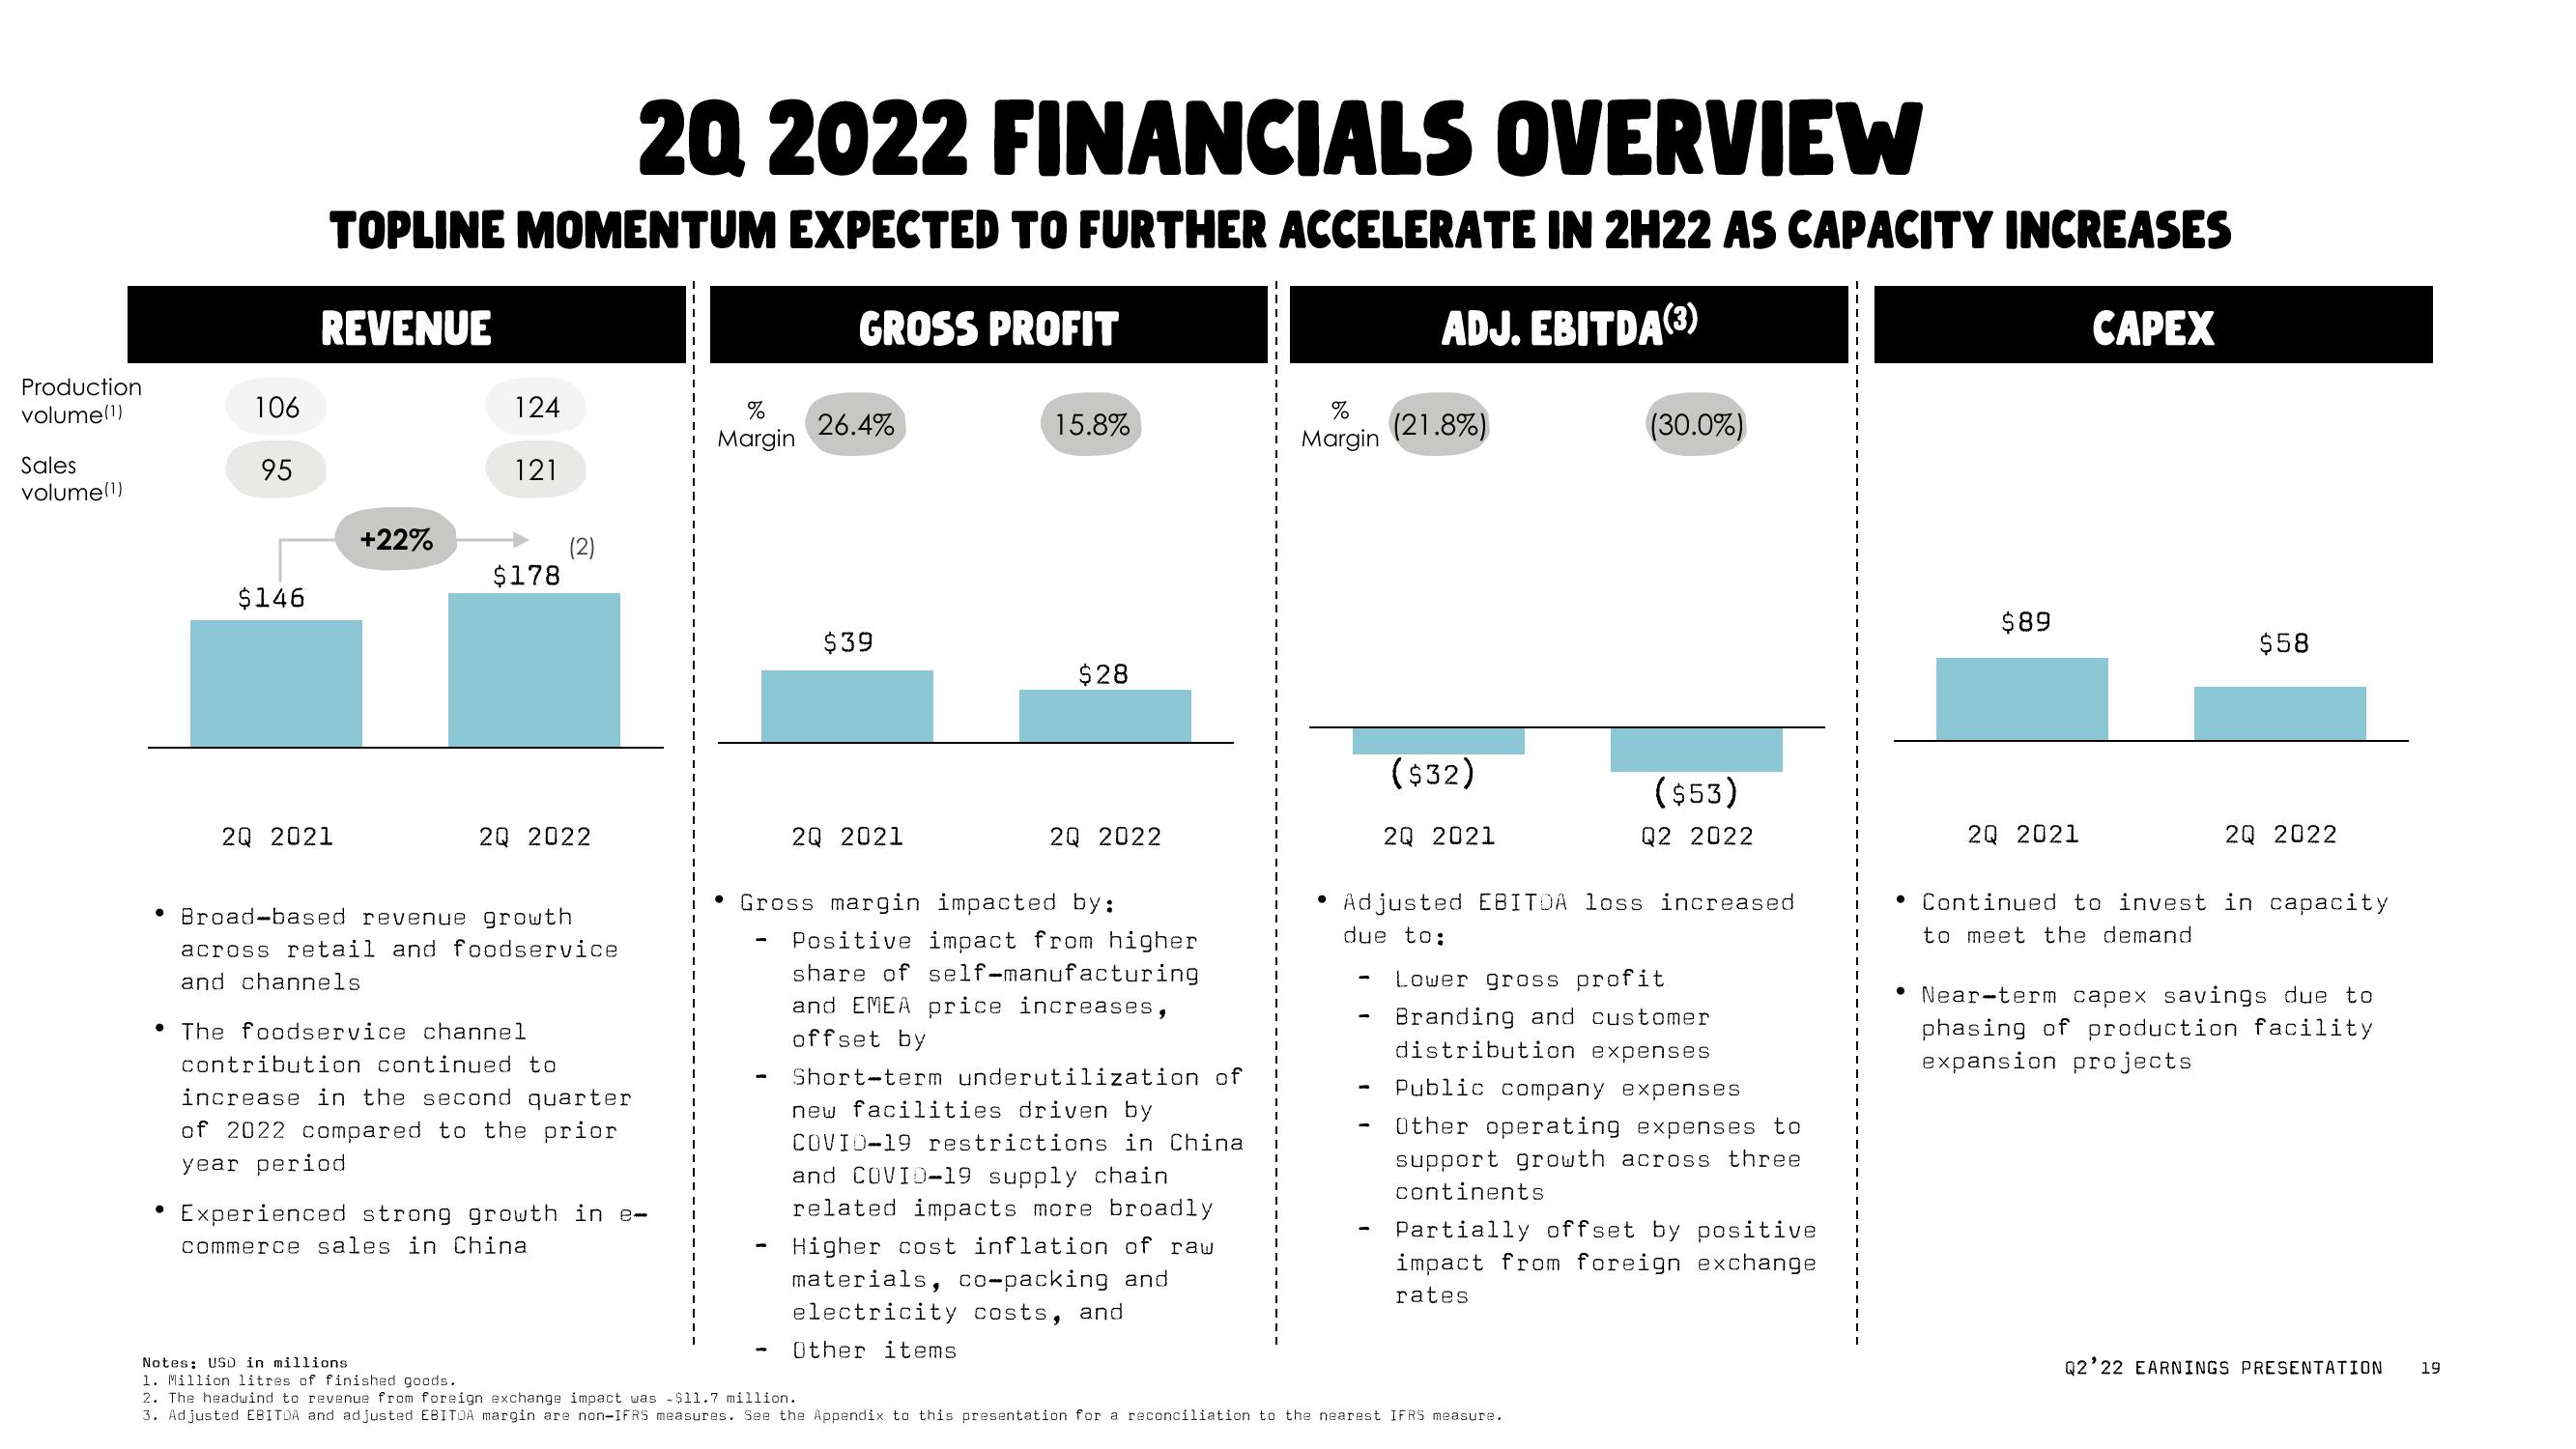
Broad-based revenue growth
across retail and foodservice
and channels
The foodservice channel
contribution continued to
increase in the second quarter
of 2022 compared to the prior
year period
Experienced strong growth in e-
commerce sales in China
%
Margin
26.4%
$39
20 2021
15.8%
$28
Other items
2Q 2022
Gross margin impacted by:
Positive impact from higher
share of self-manufacturing
and EMEA price increases,
offset by
Short-term underutilization of
new facilities driven by
COVID-19 restrictions in China
and COVID-19 supply chain
related impacts more broadly
Higher cost inflation of raw
materials, co-packing and
electricity costs, and
%
Margin
●
(21.8%)
($32)
20 2021
(30.0%)
($53)
Q2 2022
Adjusted EBITDA loss increased
due to:
Notes: USD in millions
1. Million litres of finished goods.
2. The headwind to revenue from foreign exchange impact was $11.7 million.
3. Adjusted EBITDA and adjusted EBITDA margin are non-IFRS measures. See the Appendix to this presentation for a reconciliation to the nearest IFRS measure.
Lower gross profit
Branding and customer
distribution expenses
Public company expenses
Other operating expenses to
support growth across three
continents
Partially offset by positive
impact from foreign exchange
rates
$89
20 2021
$58
2Q 2022
Continued to invest in capacity
to meet the demand
Near-term capex savings due to
phasing of production facility.
expansion projects.
Q2'22 EARNINGS PRESENTATION
19View entire presentation