Barclays Investment Banking Pitch Book
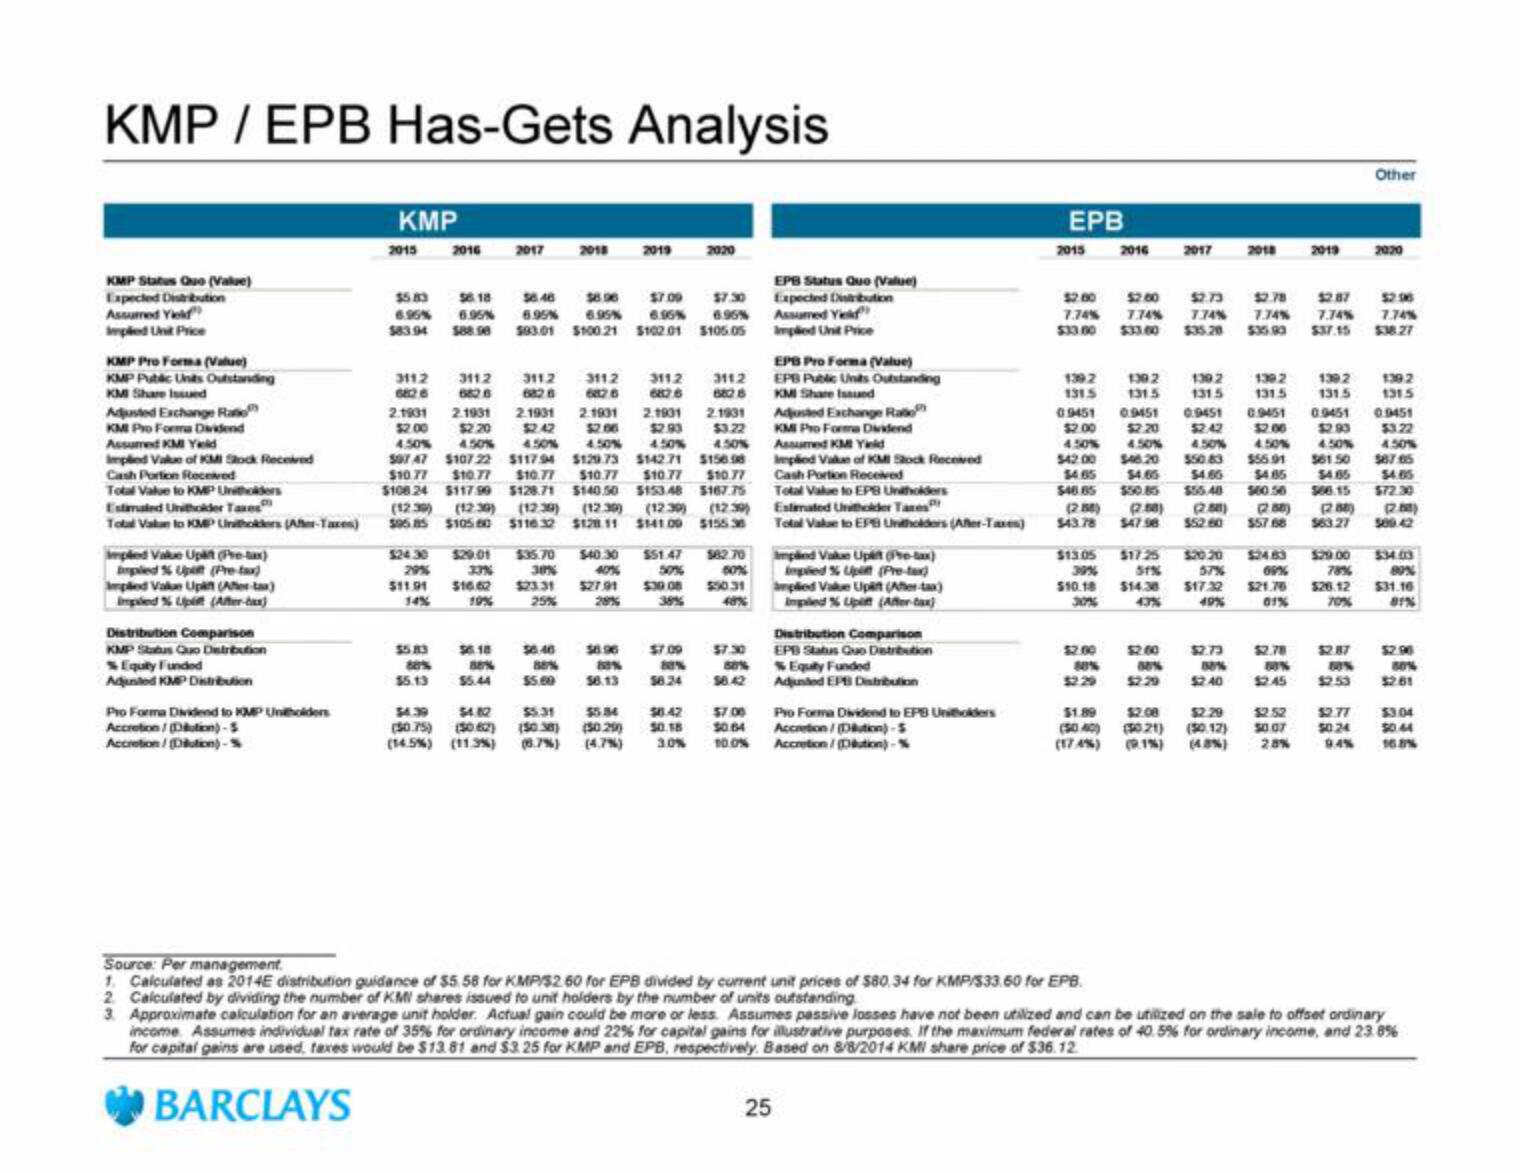
KMP / EPB Has-Gets Analysis
KMP Status Quo (Value)
Expected Distribution
Assumed Yield
implied Unit Price
KMP Pro Forma (Value)
KMP Public Units Outstanding
KM Share Issued
Adjusted Exchange Rate
KM Pro Forma Dividend
Assumed KMI Yld
implied Value of KM Stock Received
Cash Portion Received
Total Valve to KMP Unitholders
Estimated Unitholder Taxes
Total Valun to KMP Unihokers (After-Taxes)
implied Value Uplit (Pre-tax)
pled % Upat (Pre-tax)
Implied Value Upan (After-tax)
Imped % Up (After-x)
Distribution Comparison
KMP Status Quo Distribution
Equity Funded
Adjunted KMP Distribution
Pro Forma Dividend to KOMP Unitholders
Accretion/Dution)-5
Accretion/Dution)-S
KMP
2015
3112
6826
2016
$5.83 58.18 56.46 58.96 $7.00 $7.30
6.96% 6.95% 6.95% 6.95% 6.96% 6.96%
$83.94 $88.98 $83.01 $100.21 $102.01 $105.05
$24.30
29%
$11.91
14%
2.1931
$2.00
4.50%
311.2 311.2 311.2 3112
6826
6826
2.1931 2.1931 2.1931 2.1931 2.1931
$2.20 $2.42 $2.06 $2.93 $3.22
4.50% 4.50% 4.50% 4.50%
507 47 $107 22
$117.94 $129.73 $142.71 $156.98
$10.77 $10.77 $10.77 $10.77 $10.77 $10.77
$108.24 $117.99 $128.71 $140.50 $153.48 $167.75
(1230) (12:30) (12:30) (12.30) (12:30) (12:30)
596 85 $105.60 $116.32 $128.11 $141.00 $155.36
$40.30
$5.83
80%
$5.13
3112
2017 2018 2019
$29.01 $35.70
30%
$23.31
25%
$16.62
19%
$6.18
88%
$5.44
$4.39
$4.82
($0.75) (50 62)
(14.5%) (11.3%)
$6.40
88%
$5.00
2020
83%
56.13
$51.47 562.70
50%
60%
$27.91 $30.08 5:50.31
28%
48%
38%
$7.09
80%
56.24
$7.30
$5.31 $5.84 $0.42 $7.00
(50.38) (50.290) 50.18 50.64
(6.7%) (4.7%) 3.0% 10.0%
EPB Status Quo (Value)
Expected Distribution
Assumed Yek
Implied Unit Price
EPB Pro Forma (Value)
EPB Public Units Outstanding
KMI Share Issued
Adjusted Exchange Rate
KM Pro Forma Dividend
Assumed KM Yild
implied Value of KMI Stock Received
Cash Portion Received
Total Value to EPB Unitholders
Estimated Unitholder Taxes
Total Value to EPB Unitholders (Afler-Taxes)
25
implied Value Uplit (Pre-tax)
implied % Upit (Pre-tex
amplied Value Up (Art)
Implied% Upit (After tax)
Distribution Comparison
EPB Status Quo Distribution
%Equity Funded
Adjunted EPS Distribution
Pro Forma Dividend to EPB Unitholders
Accretion/Dution)-5
Accretion/Dution)-%
EPB
2015
2016
$2.00
7.74% 7.74%
$33.00
$2.00
$2.00
80%
52.29
2017
80%
$2.73
7.74%
$2.73
80%
2018
$2.40
2019
139.2
139.2
139.2 139.2 1302
1392
131.5 131.5 131.5
131.5 131.5
131.5
0.9451 0.9451 0.9451 0.9451 0.9451 0.9451
$2.00 $2.20 52.42 $2.00
$3.22
4.50% 4.50% 4.50% 4.50%
4.50%
$42.00
$46.20
550.83 $56.91 561.50 987.05
14.65 $4.66 54.66 $4.85 $4.65 54.85
$46.65 $50.85 $55.40 560.56 506.15 $72.30
(258) (2.88) (288) (288)
(288)
(28)
$43.78 $47.98 $52.60 $57.68 563.27 500.42
$13.05
39%
$29.00 $34.03
78% 80%
$17.25 $20.20 $24.63
51% 57% 09%
$10.18 $14.30 $17.32 $21.76 $26.12 $31.16
30%
49%
01%
70%
81%
$2.87
Other
$2.78
$2.96
7.74% 7.74% 7.74%
$35.93 $37.15 5:38.27
2020
$1.89 $2.08 $2.29 $2.52 12.77
(50.40) (50.21) (30.12) 50.07 50.24
(17.4%)
(9.1%) (4.8%) 28% 9.4%
$2.78 $2.87 $2.90
80% 80%
80%
$2.45 $2.53 $2.61
$3.04
50.44
16.8%
Source: Per management.
1. Calculated as 2014E distribution guidance of $5.58 for KMP/$2.60 for EPB divided by current unit prices of $80.34 for KMP/S33.60 for EPB.
2. Calculated by dividing the number of KMI shares issued to unit holders by the number of units outstanding
3. Approximate calculation for an average unit holder. Actual gain could be more or less. Assumes passive losses have not been utilized and can be utilized on the sale to offset ordinary
income Assumes individual tax rate of 35% for ordinary income and 22% for capital gains for illustrative purposes. If the maximum federal rates of 40.5% for ordinary income, and 23. 8%
for capital gains are used, taxes would be $13.81 and $3. 25 for KMP and EPB, respectively. Based on 8/8/2014 KMI share price of $36.12.
BARCLAYSView entire presentation