Lyft Results Presentation Deck
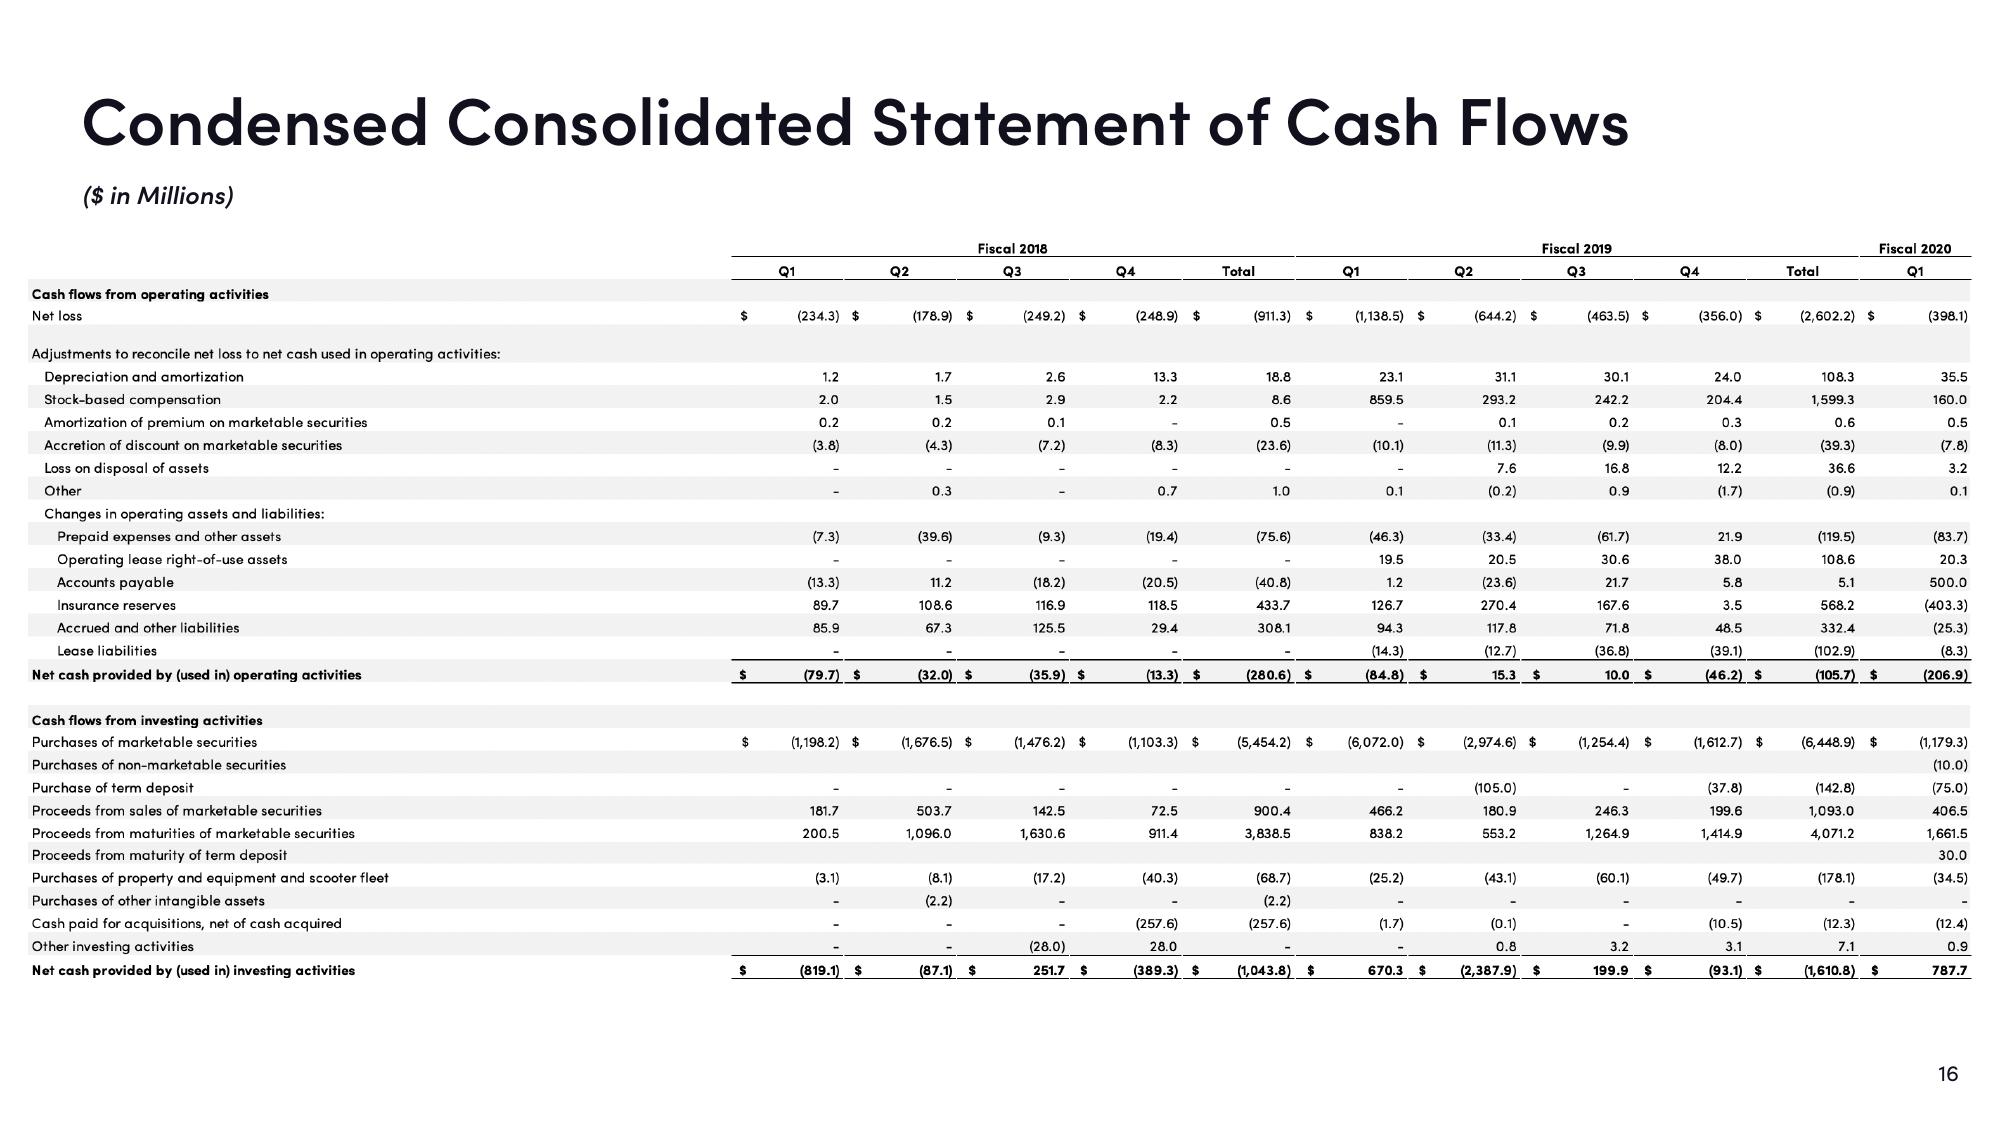
Condensed Consolidated
($ in Millions)
Cash flows from operating activities
Net loss
Adjustments to reconcile net loss to net cash used in operating activities:
Depreciation and amortization
Stock-based compensation
Amortization of premium on marketable securities
Accretion of discount on marketable securities
Loss on disposal of assets
Other
Changes in operating assets and liabilities:
Prepaid expenses and other assets
Operating lease right-of-use assets
Accounts payable
Insurance reserves
Accrued and other liabilities
Lease liabilities
Net cash provided by (used in) operating activities
Cash flows from investing activities
Purchases of marketable securities
Purchases of non-marketable securities
Purchase of term deposit
Proceeds from sales of marketable securities
Proceeds from maturities of marketable securities
Proceeds from maturity of term deposit
Consolidated Statement of Cash Flows
Purchases of property and equipment and scooter fleet
Purchases of other intangible assets
Cash paid for acquisitions, net of cash acquired
Other investing activities
Net cash provided by (used in) investing activities
$
$
$
$
Q1
(234.3) $
1.2
2.0
0.2
(3.8)
(7.3)
(13.3)
89.7
85.9
(79.7) $
(1,198.2) $
181.7
200.5
(3.1)
(819.1) $
Q2
(178.9) $
1.7
1.5
0.2
(4.3)
0.3
(39.6)
11.2
108.6
67.3
(32.0) $
(1,676.5) $
503.7
1,096.0
(8.1)
(2.2)
(87.1) $
Fiscal 2018
Q3
(249.2) $
2.6
2.9
0.1
(7.2)
(9.3)
(18.2)
116.9
125.5
(35.9) $
(1,476.2) $
142.5
1,630.6
(17.2)
(28.0)
251.7
$
Q4
(248.9) $
13.3
2.2
(8.3)
0.7
(19.4)
(20.5)
118.5
29.4
(13.3) $
(1,103.3) $
72.5
911.4
(40.3)
(257.6)
28.0
(389.3) $
Total
(911.3) $
18.8
8.6
0.5
(23.6)
1.0
(75.6)
(40.8)
433.7
308.1
(280.6) $
(5,454.2) $
900.4
3,838.5
(68.7)
(2.2)
(257.6)
(1,043.8)
$
Q1
(1,138.5) $
23.1
859.5
(10.1)
0.1
(46.3)
19.5
1.2
126.7
94.3
(14.3)
(84.8) $
(6,072.0) $
466.2
838.2
(25.2)
(1.7)
Q2
(644.2) $
31.1
293.2
0.1
(11.3)
7.6
(0.2)
(33.4)
20.5
(23.6)
270.4
117.8
(12.7)
15.3 $
(2,974.6) $
(105.0)
180.9
553.2
(43.1)
(0.1)
0.8
670.3 $ (2,387.9) $
Fiscal 2019
Q3
(463.5) $
30.1
242.2
0.2
(9.9)
16.8
0.9
(61.7)
30.6
21.7
167.6
71.8
(36.8)
10.0 $
(1,254.4) $
246.3
1,264.9
(60.1)
3.2
199.9
$
Q4
(356.0) $
24.0
204.4
0.3
(8.0)
12.2
(1.7)
21.9
38.0
5.8
3.5
48.5
(39.1)
(46.2) $
(1,612.7) $
(37.8)
199.6
1,414.9
(49.7)
(10.5)
3.1
(93.1) $
Total
(2,602.2) $
108.3
1,599.3
0.6
(39.3)
36.6
(0.9)
(119.5)
108.6
5.1
568.2
332.4
(102.9)
(105.7) $
(6,448.9) $
(142.8)
1,093.0
4,071.2
(178.1)
Fiscal 2020
Q1
(12.3)
7.1
(1,610.8)
$
(398.1)
35.5
160.0
0.5
(7.8)
3.2
0.1
(83.7)
20.3
500.0
(403.3)
(25.3)
(8.3)
(206.9)
(1,179.3)
(10.0)
(75.0)
406.5
1,661.5
30.0
(34.5)
(12.4)
0.9
787.7
16View entire presentation