XP Inc Results Presentation Deck
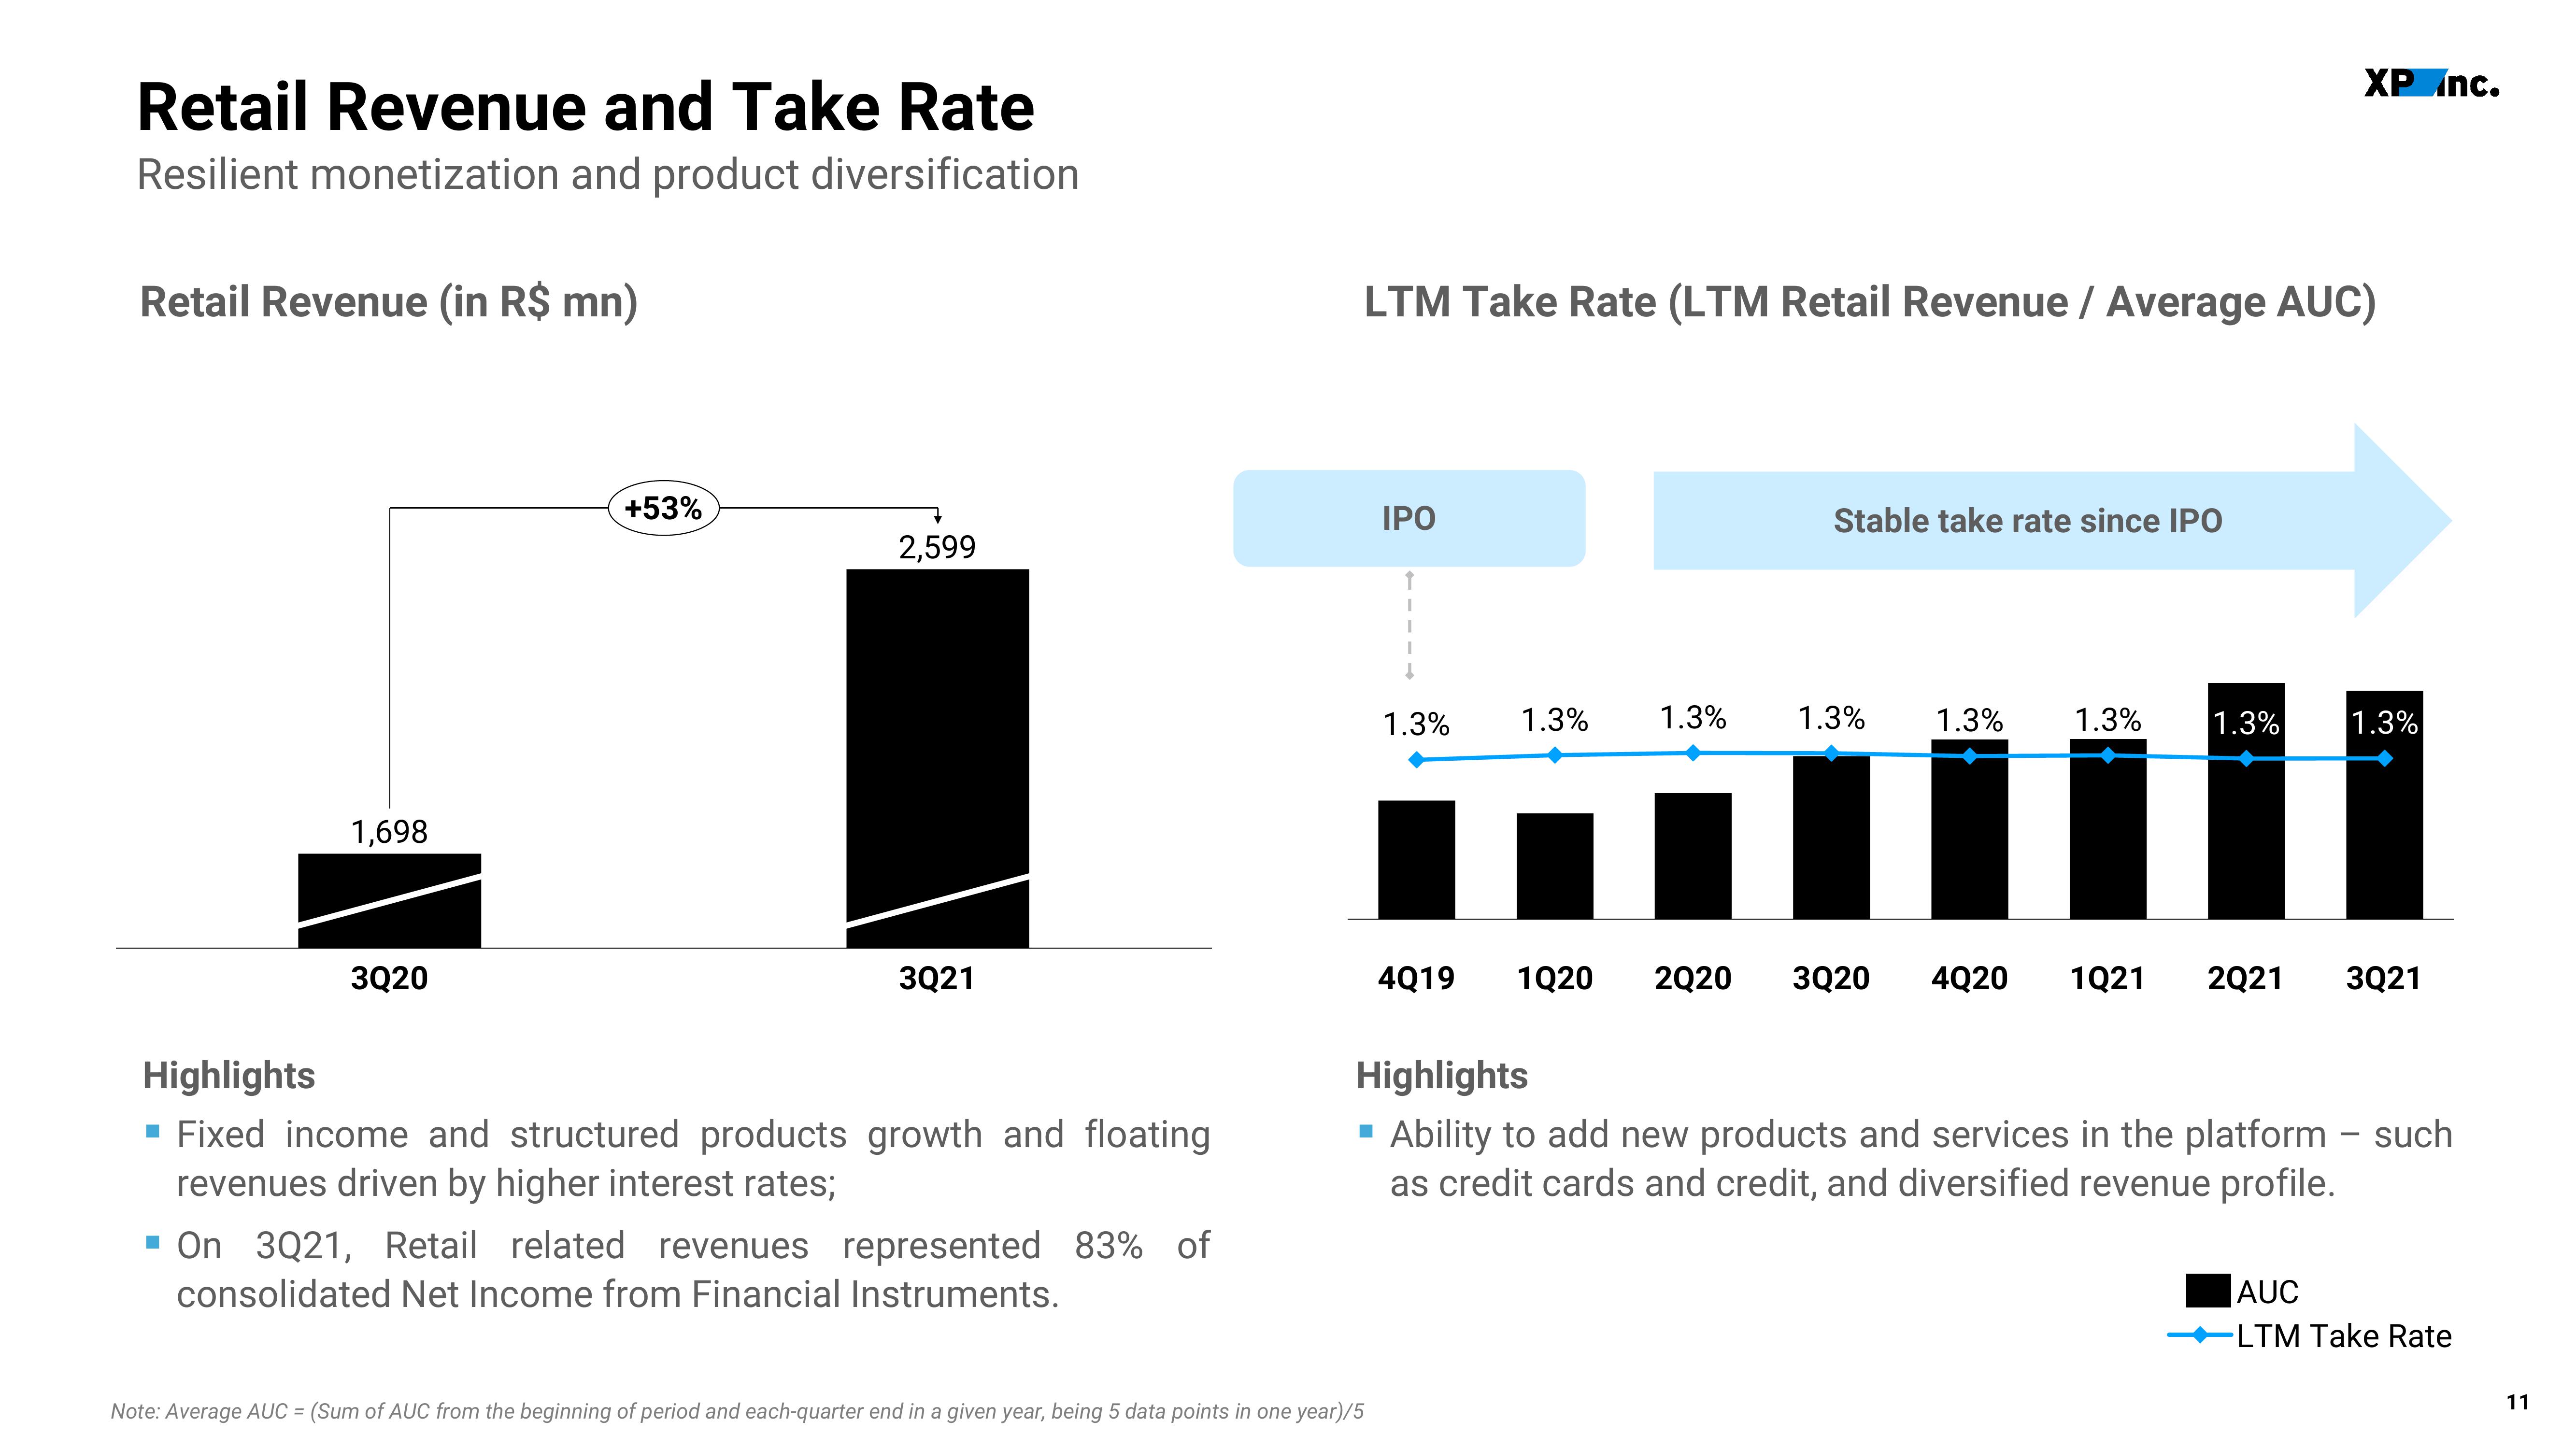
Retail Revenue and Take Rate
Resilient monetization and product diversification
Retail Revenue (in R$ mn)
1,698
3Q20
+53%
2,599
3Q21
Highlights
▪ Fixed income and structured products growth and floating
revenues driven by higher interest rates;
▪ On 3Q21, Retail related revenues represented 83% of
consolidated Net Income from Financial Instruments.
LTM Take Rate (LTM Retail Revenue / Average AUC)
IPO
Note: Average AUC = (Sum of AUC from the beginning of period and each-quarter end in a given year, being 5 data points in one year)/5
↑
1.3%
4Q19
1.3%
1.3%
1Q20 2Q20
Stable take rate since IPO
1.3%
3Q20 4Q20 1Q21 2Q21 3Q21
1.3%
XP Inc.
1.3%
1.3%
1.3%
Highlights
Ability to add new products and services in the platform - such
as credit cards and credit, and diversified revenue profile.
AUC
-LTM Take Rate
11View entire presentation