First Merchants Results Presentation Deck
Non-GAAP
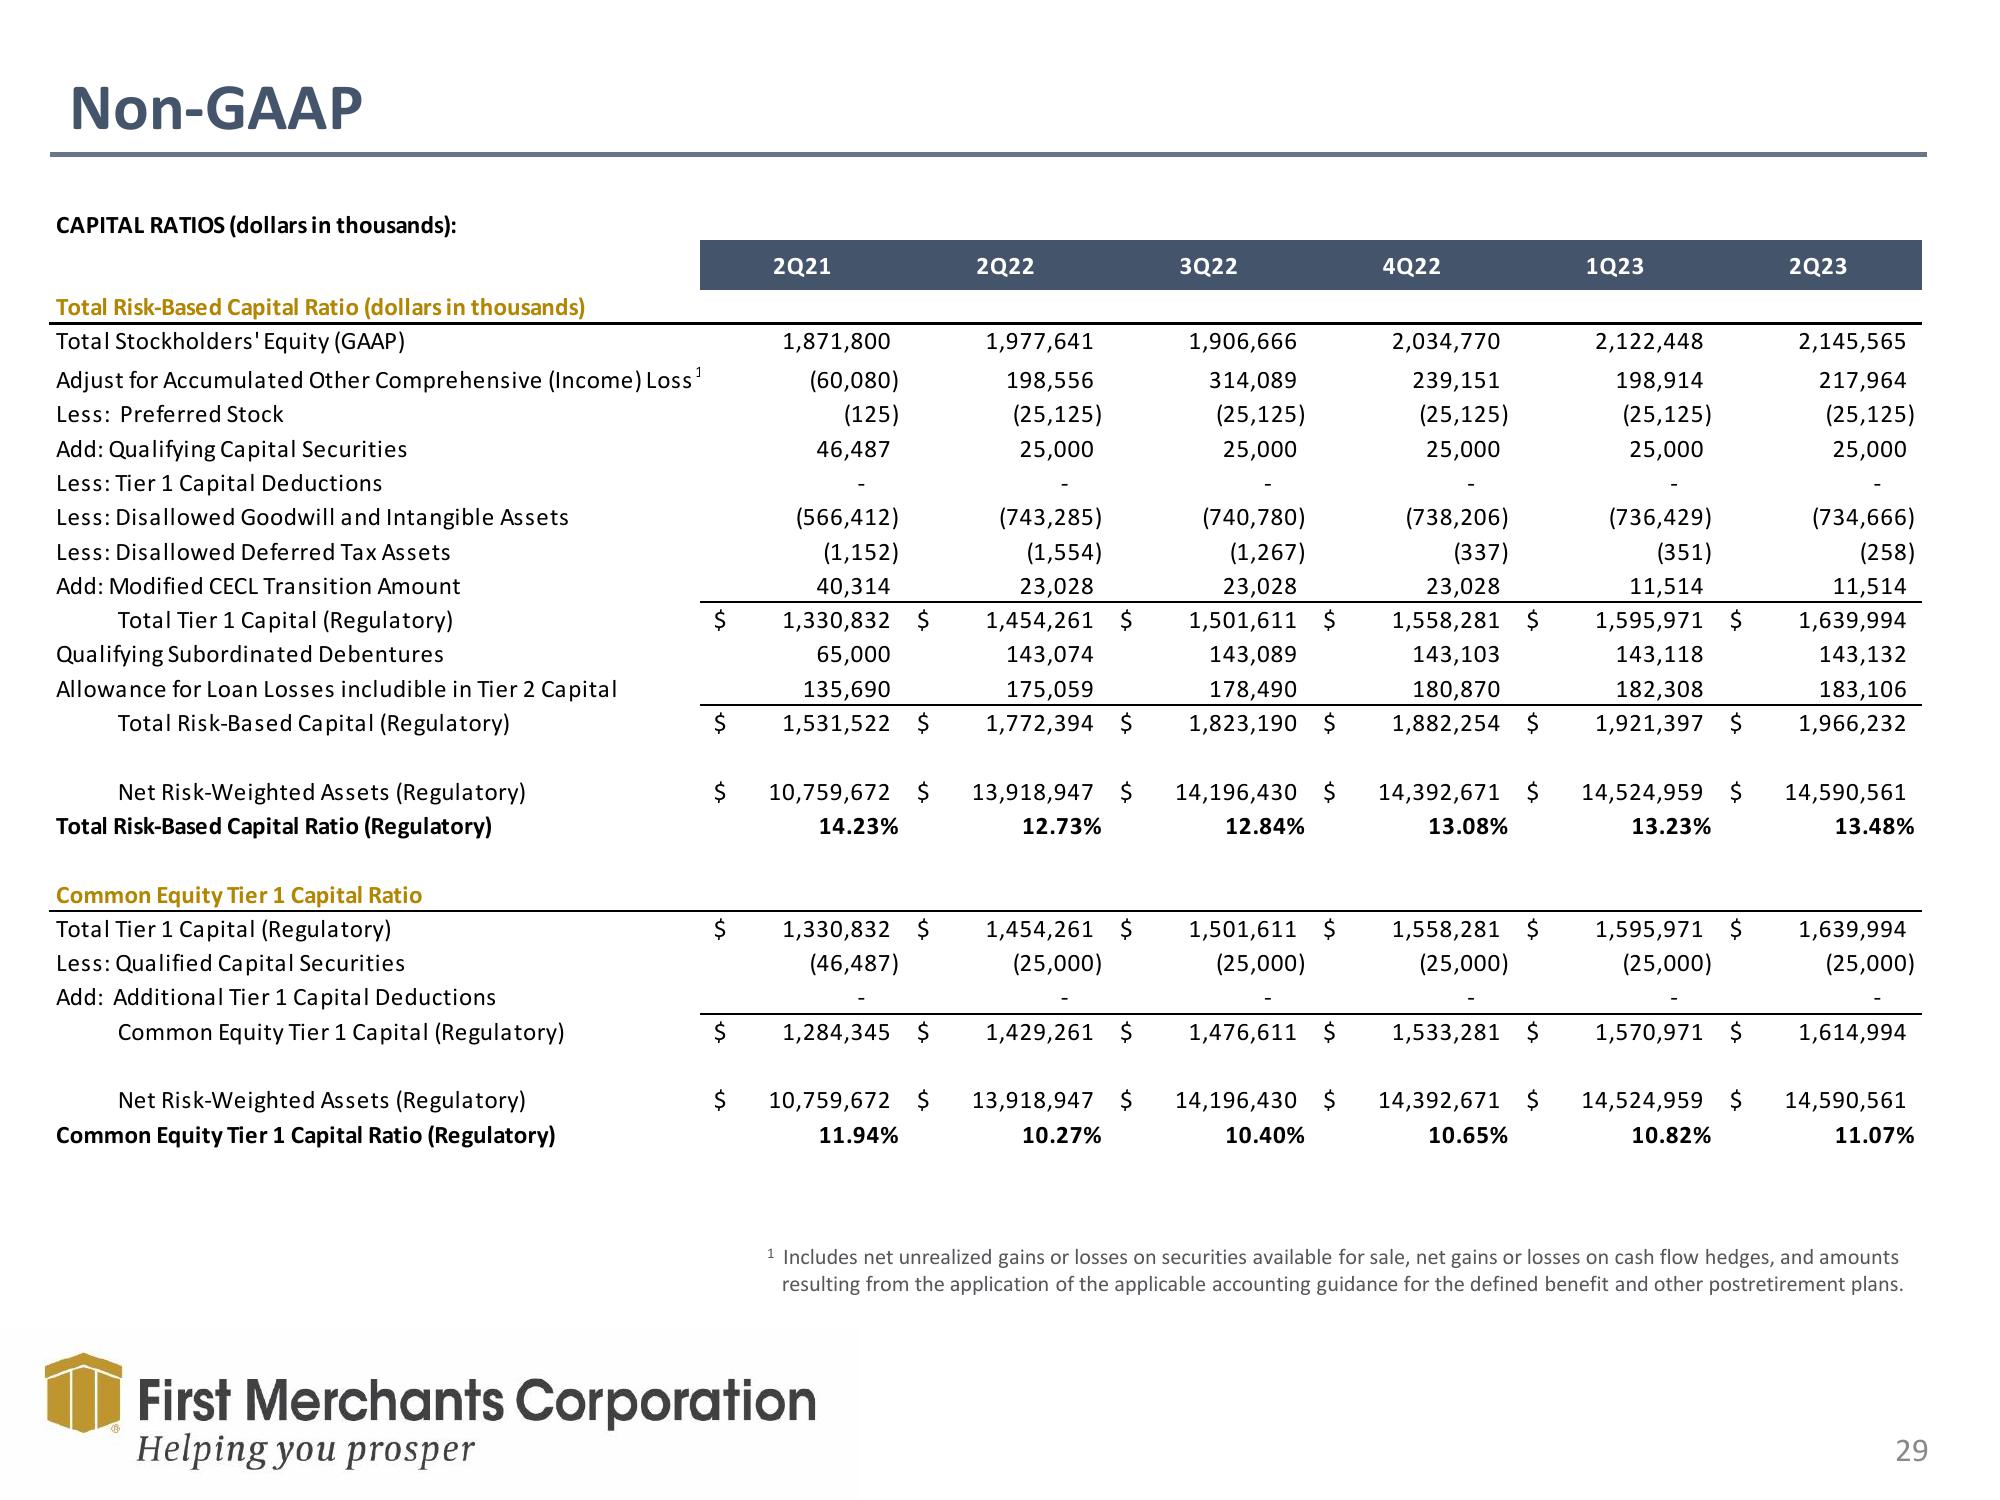
CAPITAL RATIOS (dollars in thousands):
Total Risk-Based Capital Ratio (dollars in thousands)
Total Stockholders' Equity (GAAP)
Adjust for Accumulated Other Comprehensive (Income) Loss ¹
1
Less: Preferred Stock
Add: Qualifying Capital Securities
Less: Tier 1 Capital Deductions
Less: Disallowed Goodwill and Intangible Assets
Less: Disallowed Deferred Tax Assets
Add: Modified CECL Transition Amount
Total Tier 1 Capital (Regulatory)
Qualifying Subordinated Debentures
Allowance for Loan Losses includible in Tier 2 Capital
Total Risk-Based Capital (Regulatory)
Net Risk-Weighted Assets (Regulatory)
Total Risk-Based Capital Ratio (Regulatory)
Common Equity Tier 1 Capital Ratio
Total Tier 1 Capital (Regulatory)
Less: Qualified Capital Securities
Add: Additional Tier 1 Capital Deductions
Common Equity Tier 1 Capital (Regulatory)
Net Risk-Weighted Assets (Regulatory)
Common Equity Tier 1 Capital Ratio (Regulatory)
$
$
(566,412)
(1,152)
40,314
$ 1,330,832 $
65,000
135,690
1,531,522 $
$
$
2Q21
$
1,871,800
(60,080)
(125)
46,487
10,759,672 $
14.23%
1,330,832 $
(46,487)
1,284,345 $
10,759,672 $
11.94%
First Merchants Corporation
Helping you prosper
2Q22
1,977,641
198,556
(25,125)
25,000
(743,285)
(1,554)
23,028
1,454,261 $
143,074
175,059
1,772,394 $
13,918,947 $
12.73%
1,454,261 $
(25,000)
1,429,261 $
13,918,947 $
10.27%
3Q22
1,906,666
314,089
(25,125)
25,000
(740,780)
(1,267)
23,028
1,501,611 $
143,089
178,490
1,823,190 $
14,196,430 $
12.84%
1,501,611 $
(25,000)
1,476,611 $
14,196,430 $
10.40%
4Q22
2,034,770
239,151
(25,125)
25,000
(738,206)
(337)
23,028
1,558,281 $
143,103
180,870
1,882,254 $
14,392,671 $
13.08%
1,558,281 $
(25,000)
1,533,281 $
14,392,671 $
10.65%
1Q23
2,122,448
198,914
(25,125)
25,000
(736,429)
(351)
11,514
1,595,971
143,118
182,308
1,921,397 $
14,524,959 $
13.23%
1,595,971 $
(25,000)
1,570,971
14,524,959 $
10.82%
2Q23
2,145,565
217,964
(25,125)
25,000
(734,666)
(258)
11,514
1,639,994
143,132
183,106
1,966,232
14,590,561
13.48%
1,639,994
(25,000)
1,614,994
14,590,561
11.07%
¹ Includes net unrealized gains or losses on securities available for sale, net gains or losses on cash flow hedges, and amounts
resulting from the application of the applicable accounting guidance for the defined benefit and other postretirement plans.
29View entire presentation