Lazard Investor Presentation Deck
INVESTOR PRESENTATION
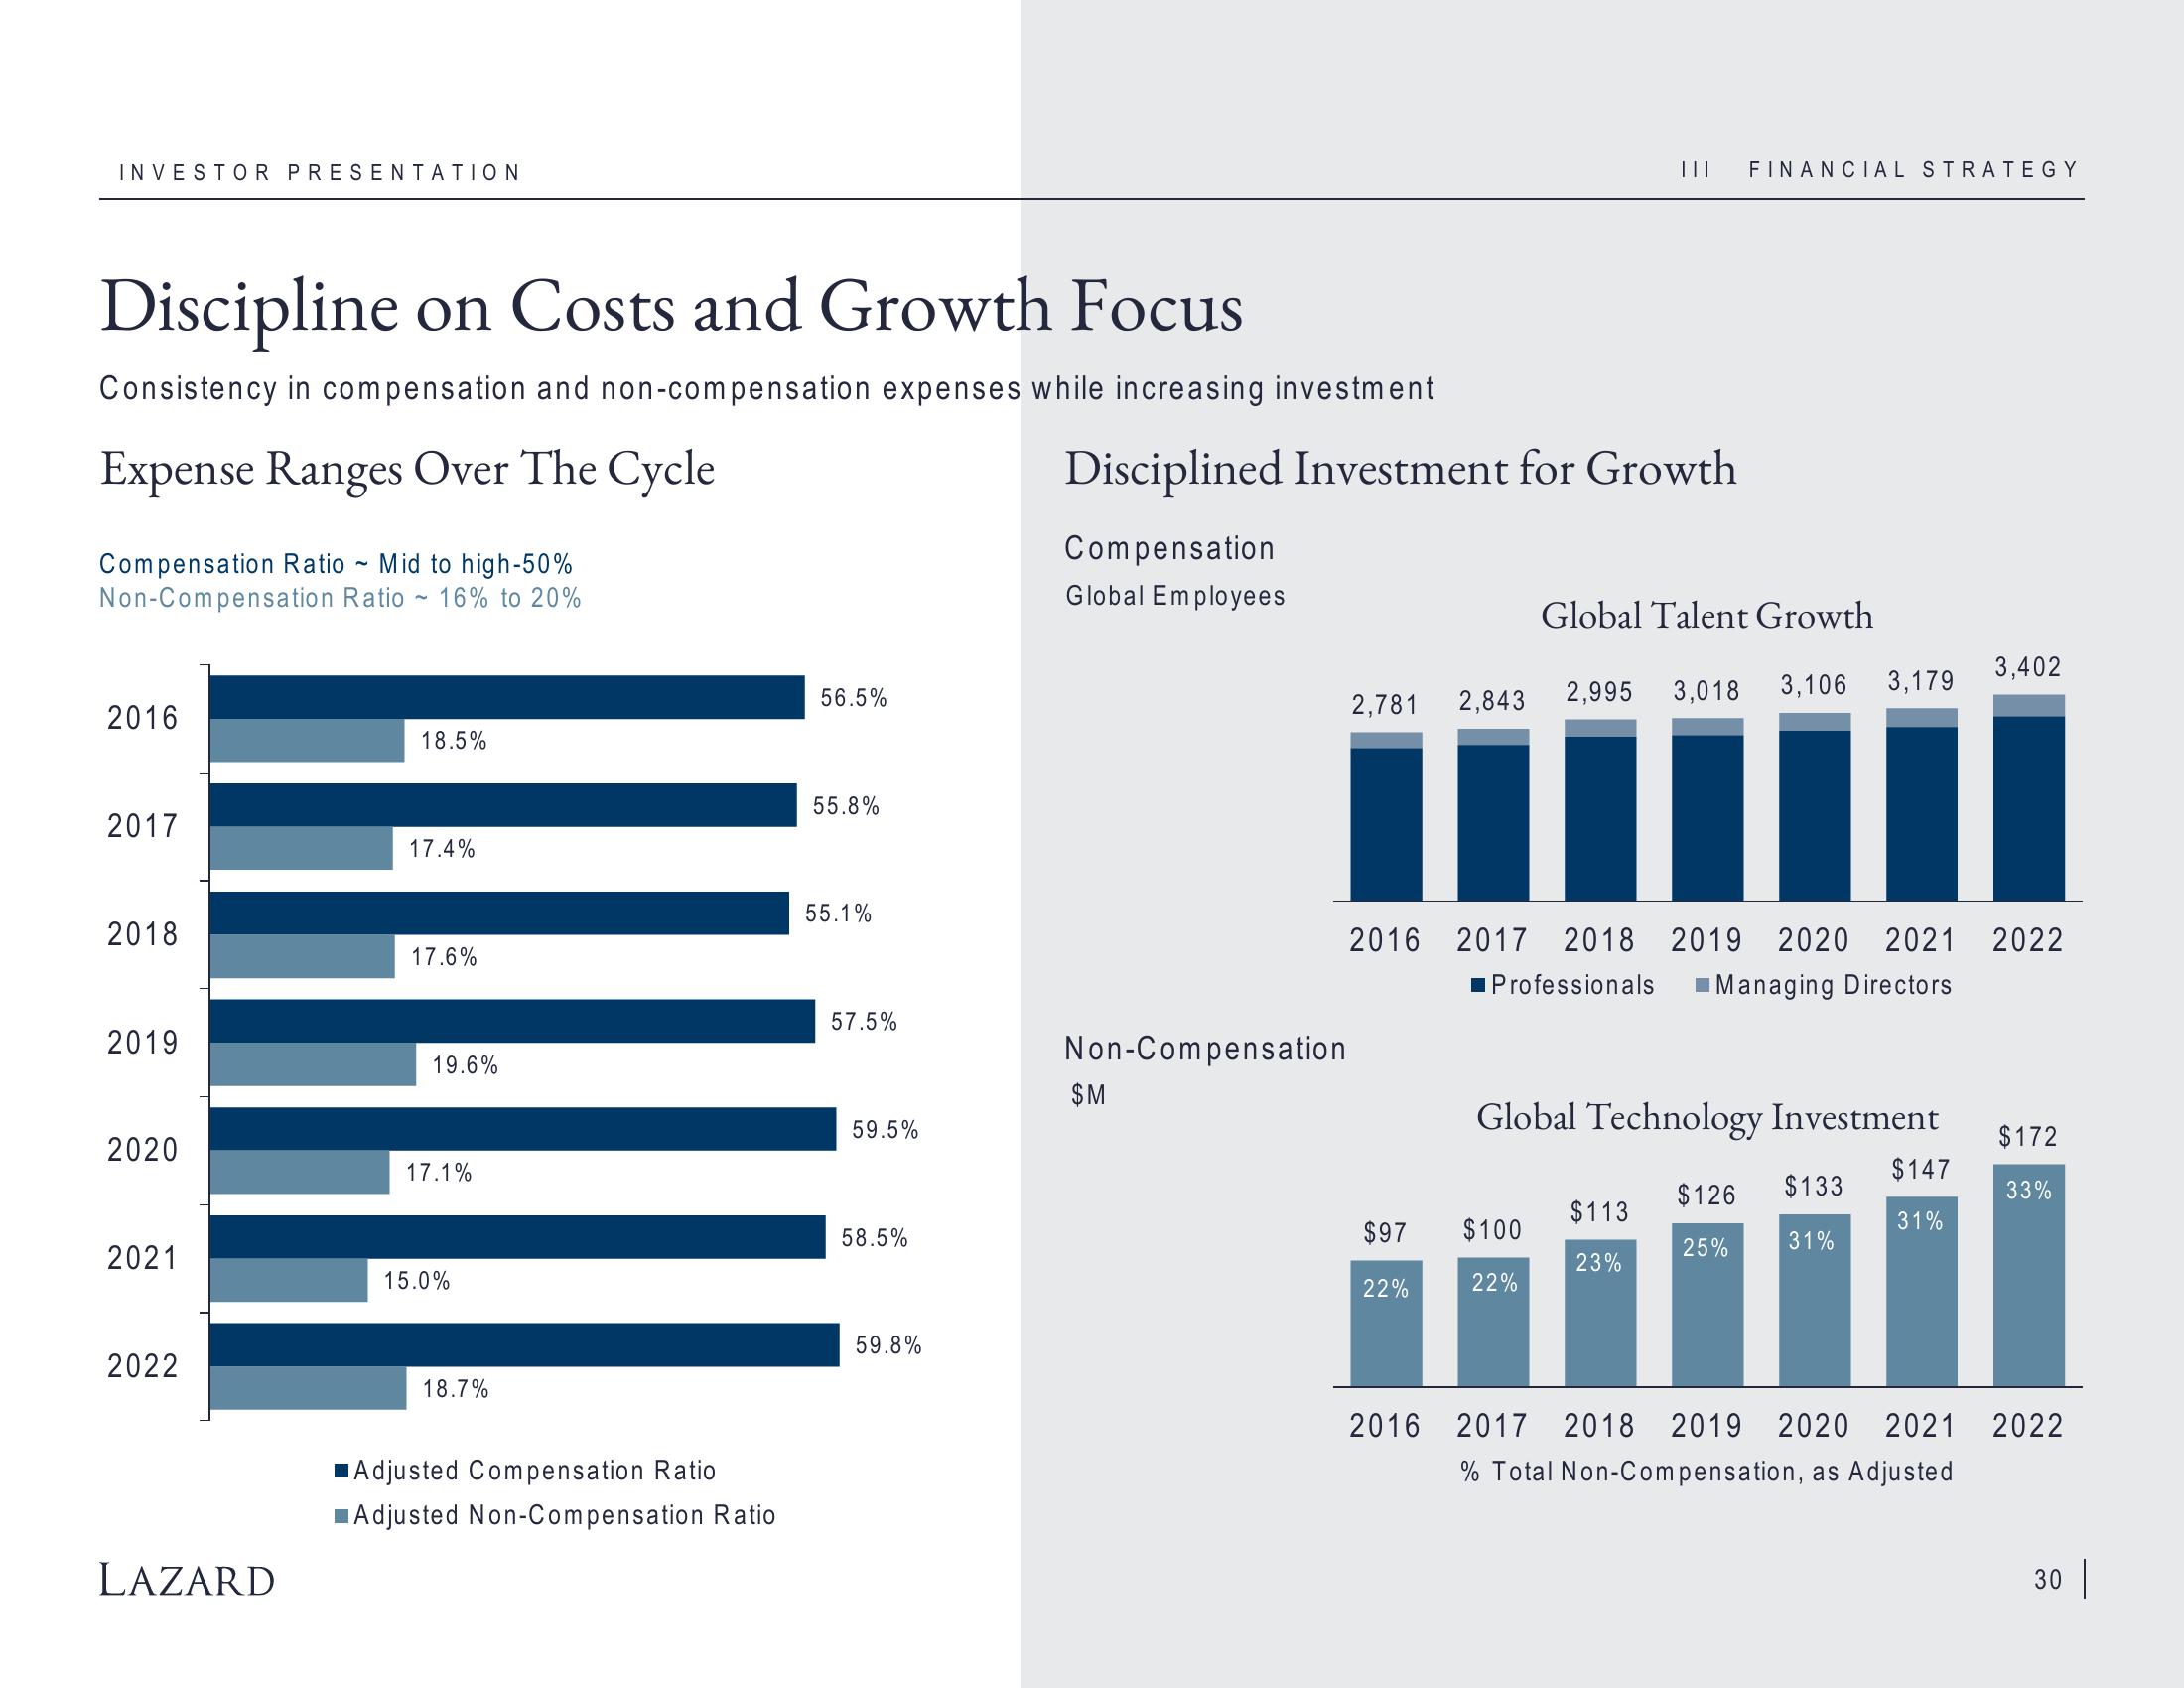
Discipline on Costs and Growth Focus
Consistency in compensation and non-compensation expenses while increasing investment
Expense Ranges Over The Cycle
Compensation Ratio Mid to high-50%
Non-Compensation Ratio - 16% to 20%
2016
2017
2018
2019
2020
2021
2022
LAZARD
2
18.5%
17.4%
17.6%
19.6%
17.1%
15.0%
18.7%
Adjusted Compensation Ratio
Adjusted Non-Compensation Ratio
56.5%
55.8%
55.1%
57.5%
59.5%
58.5%
59.8%
Disciplined Investment for Growth
Compensation
Global Employees
Non-Compensation
$M
2,781
2,843
$97
22%
||| FINANCIAL STRATEGY
Global Talent Growth
$100
22%
2,995 3,018
2016 2017 2018 2019 2020 2021 2022
Professionals Managing Directors
Global Technology Investment
$113
23%
3,106 3,179
$126
25%
$133
31%
3,402
$147
31%
$172
33%
2016 2017 2018 2019 2020 2021 2022
% Total Non-Compensation, as Adjusted
30 |View entire presentation