Nogin SPAC Presentation Deck
OUR MISSION IS TO HELP BRANDS COMPETE WITH BIG RETAIL
Market
Opportunity
Our Solution
Revenue Model
OU
10x+
LTV:CAC
2021E
nogin
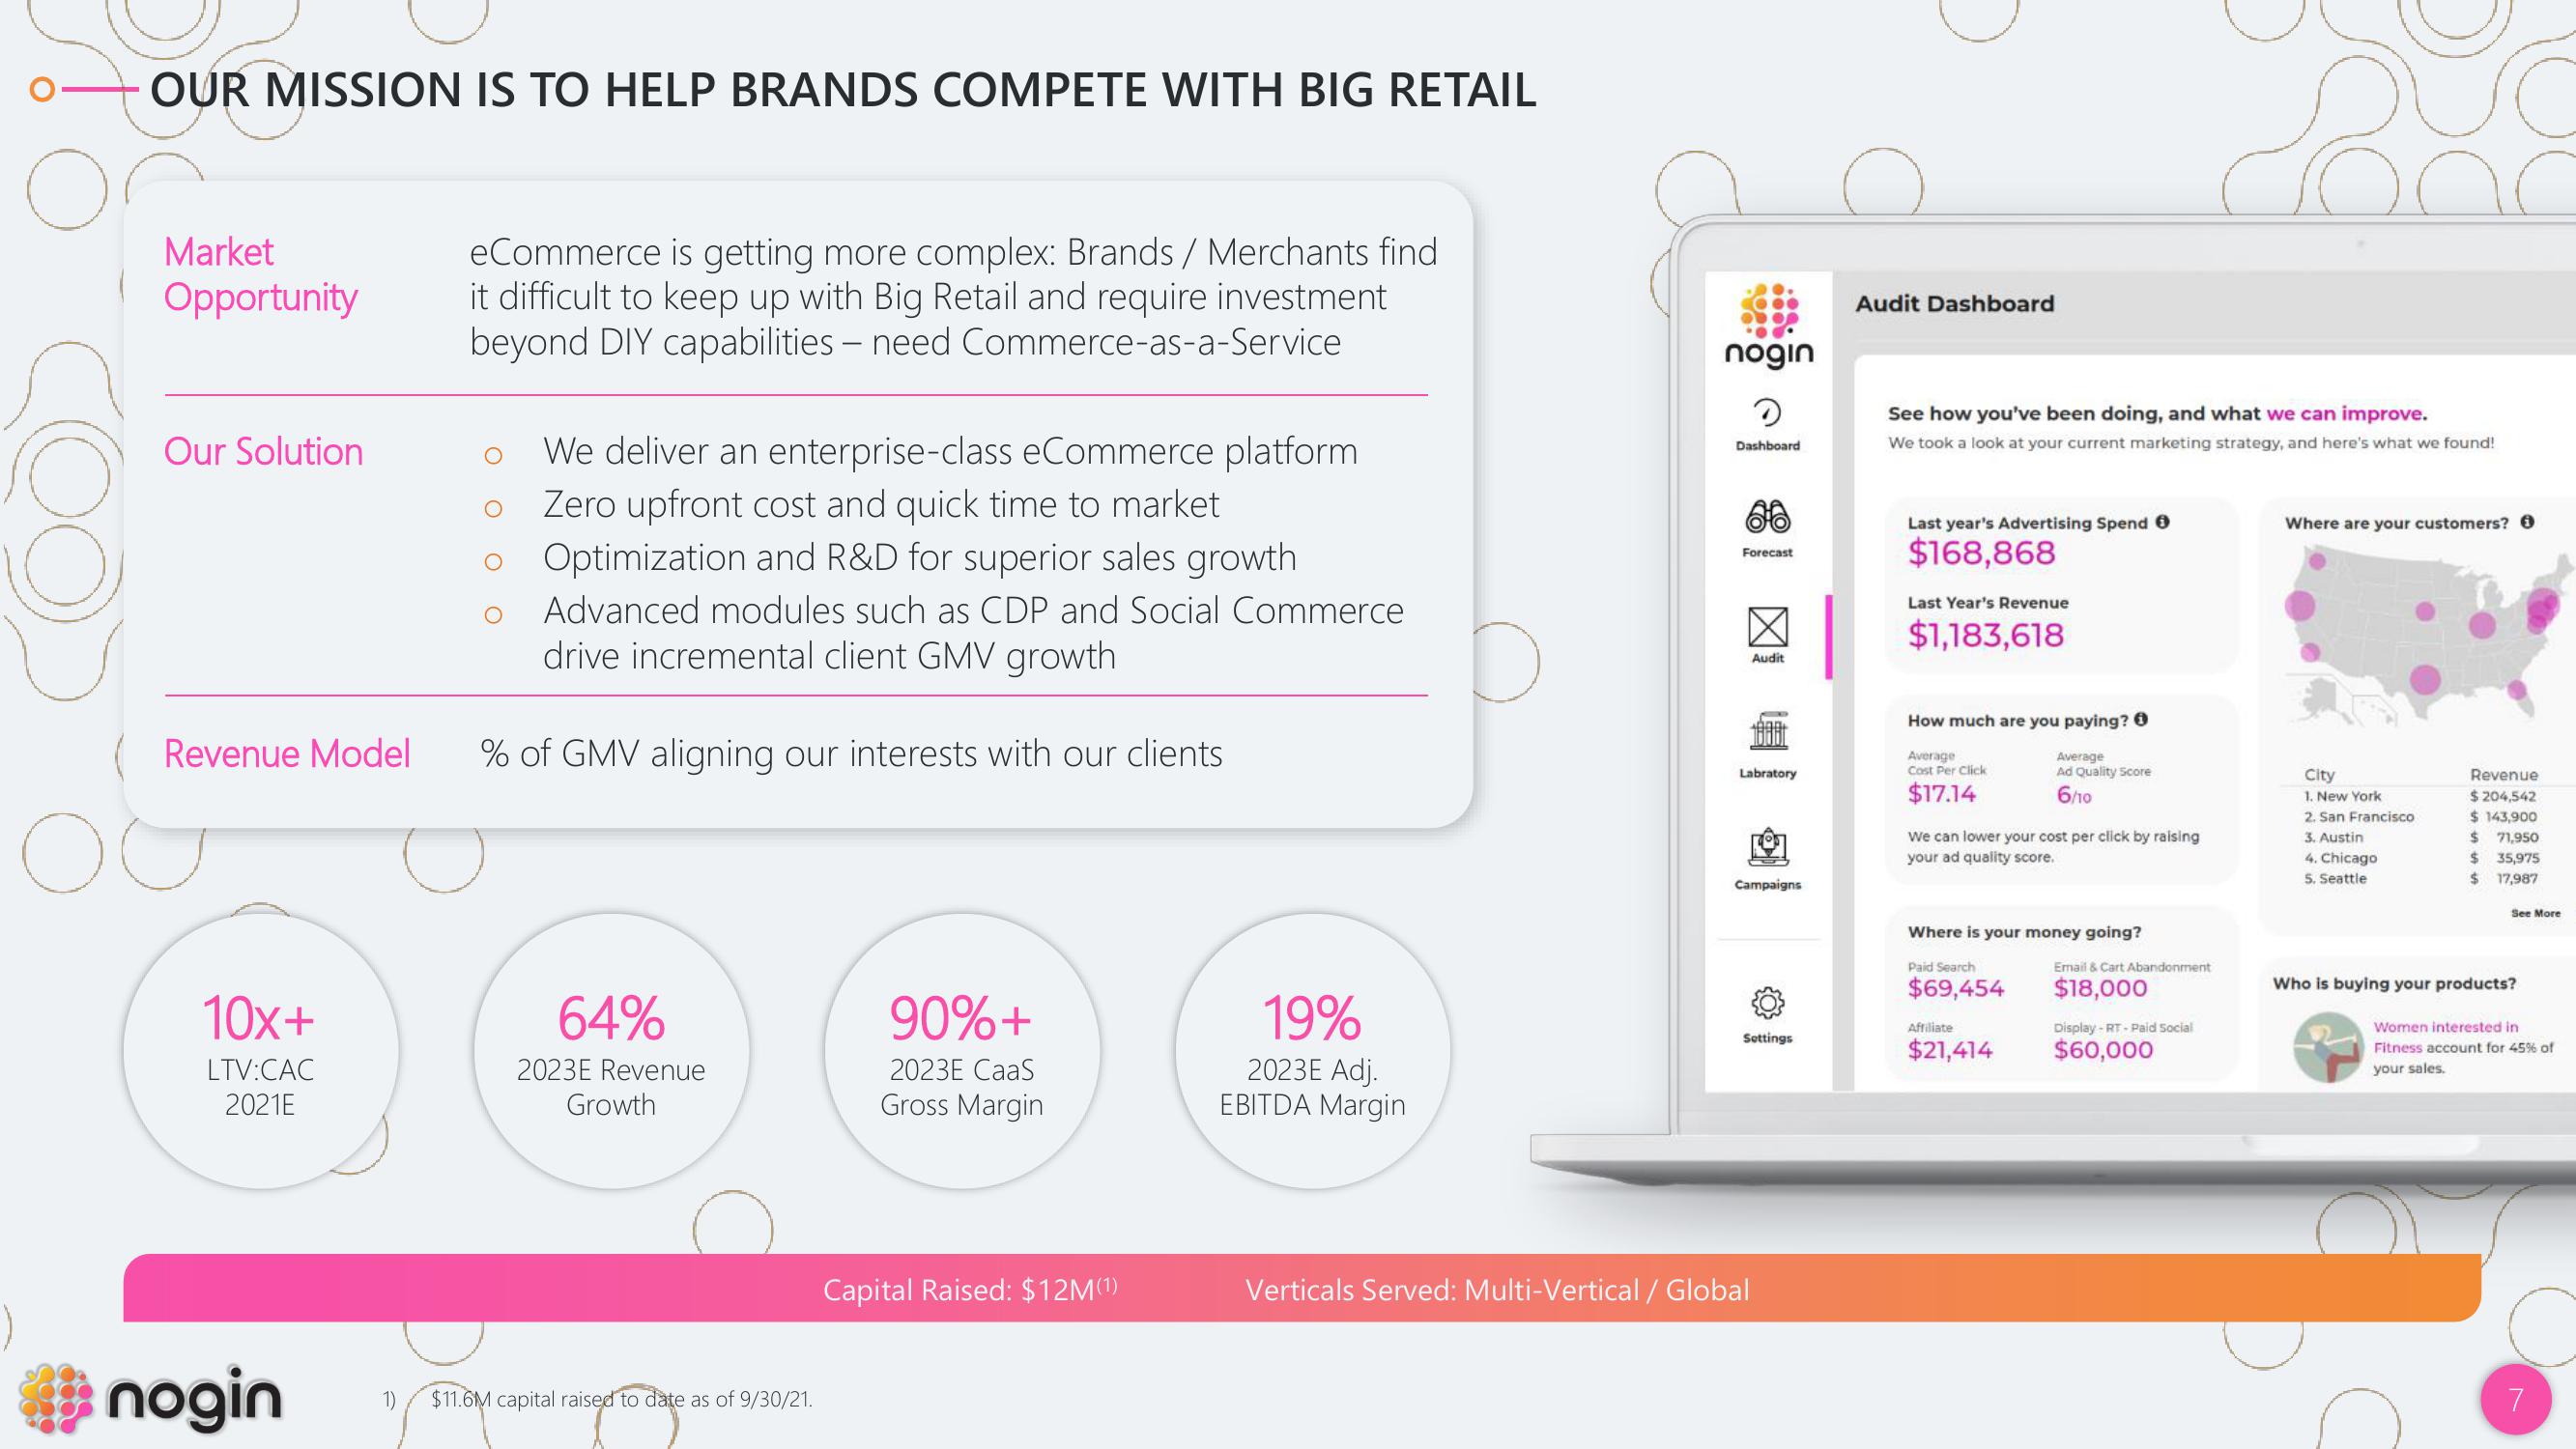
eCommerce is getting more complex: Brands / Merchants find
it difficult to keep up with Big Retail and require investment
beyond DIY capabilities - need Commerce-as-a-Service
We deliver an enterprise-class eCommerce platform
Zero upfront cost and quick time to market
Optimization and R&D for superior sales growth
Advanced modules such as CDP and Social Commerce
drive incremental client GMV growth
% of GMV aligning our interests with our clients.
64%
2023E Revenue
Growth
1) $11.6M capital raised to date as of 9/30/21.
90%+
2023E CaaS
Gross Margin
Capital Raised: $12M(¹)
19%
2023E Adj.
EBITDA Margin
nogin
?
Dashboard
Forecast
X
Audit
Labratory
Campaigns
Settings
Verticals Served: Multi-Vertical / Global
Audit Dashboard
See how you've been doing, and what we can improve.
We took a look at your current marketing strategy, and here's what we found!
Last year's Advertising Spend Ⓒ
$168,868
Last Year's Revenue
$1,183,618
How much are you paying? Ⓒ
Average
Cost Per Click
$17.14
We can lower your cost per click by raising
your ad quality score.
Average
Ad Quality Score
6/10
Where is your money going?
Paid Search
$69,454
Affiliate
$21,414
Email & Cart Abandonment
$18,000
Display-RT-Paid Social
$60,000
Where are your customers? 0
City
1. New York
2. San Francisco
3. Austin
4. Chicago
5. Seattle
Revenue
$ 204,542
$ 143,900
$
71,950
$ 35,975
$17,987
See More
Who is buying your products?
Women interested in
Fitness account for 45% of
your sales.
7View entire presentation