Consistent Progress Investor Presentation
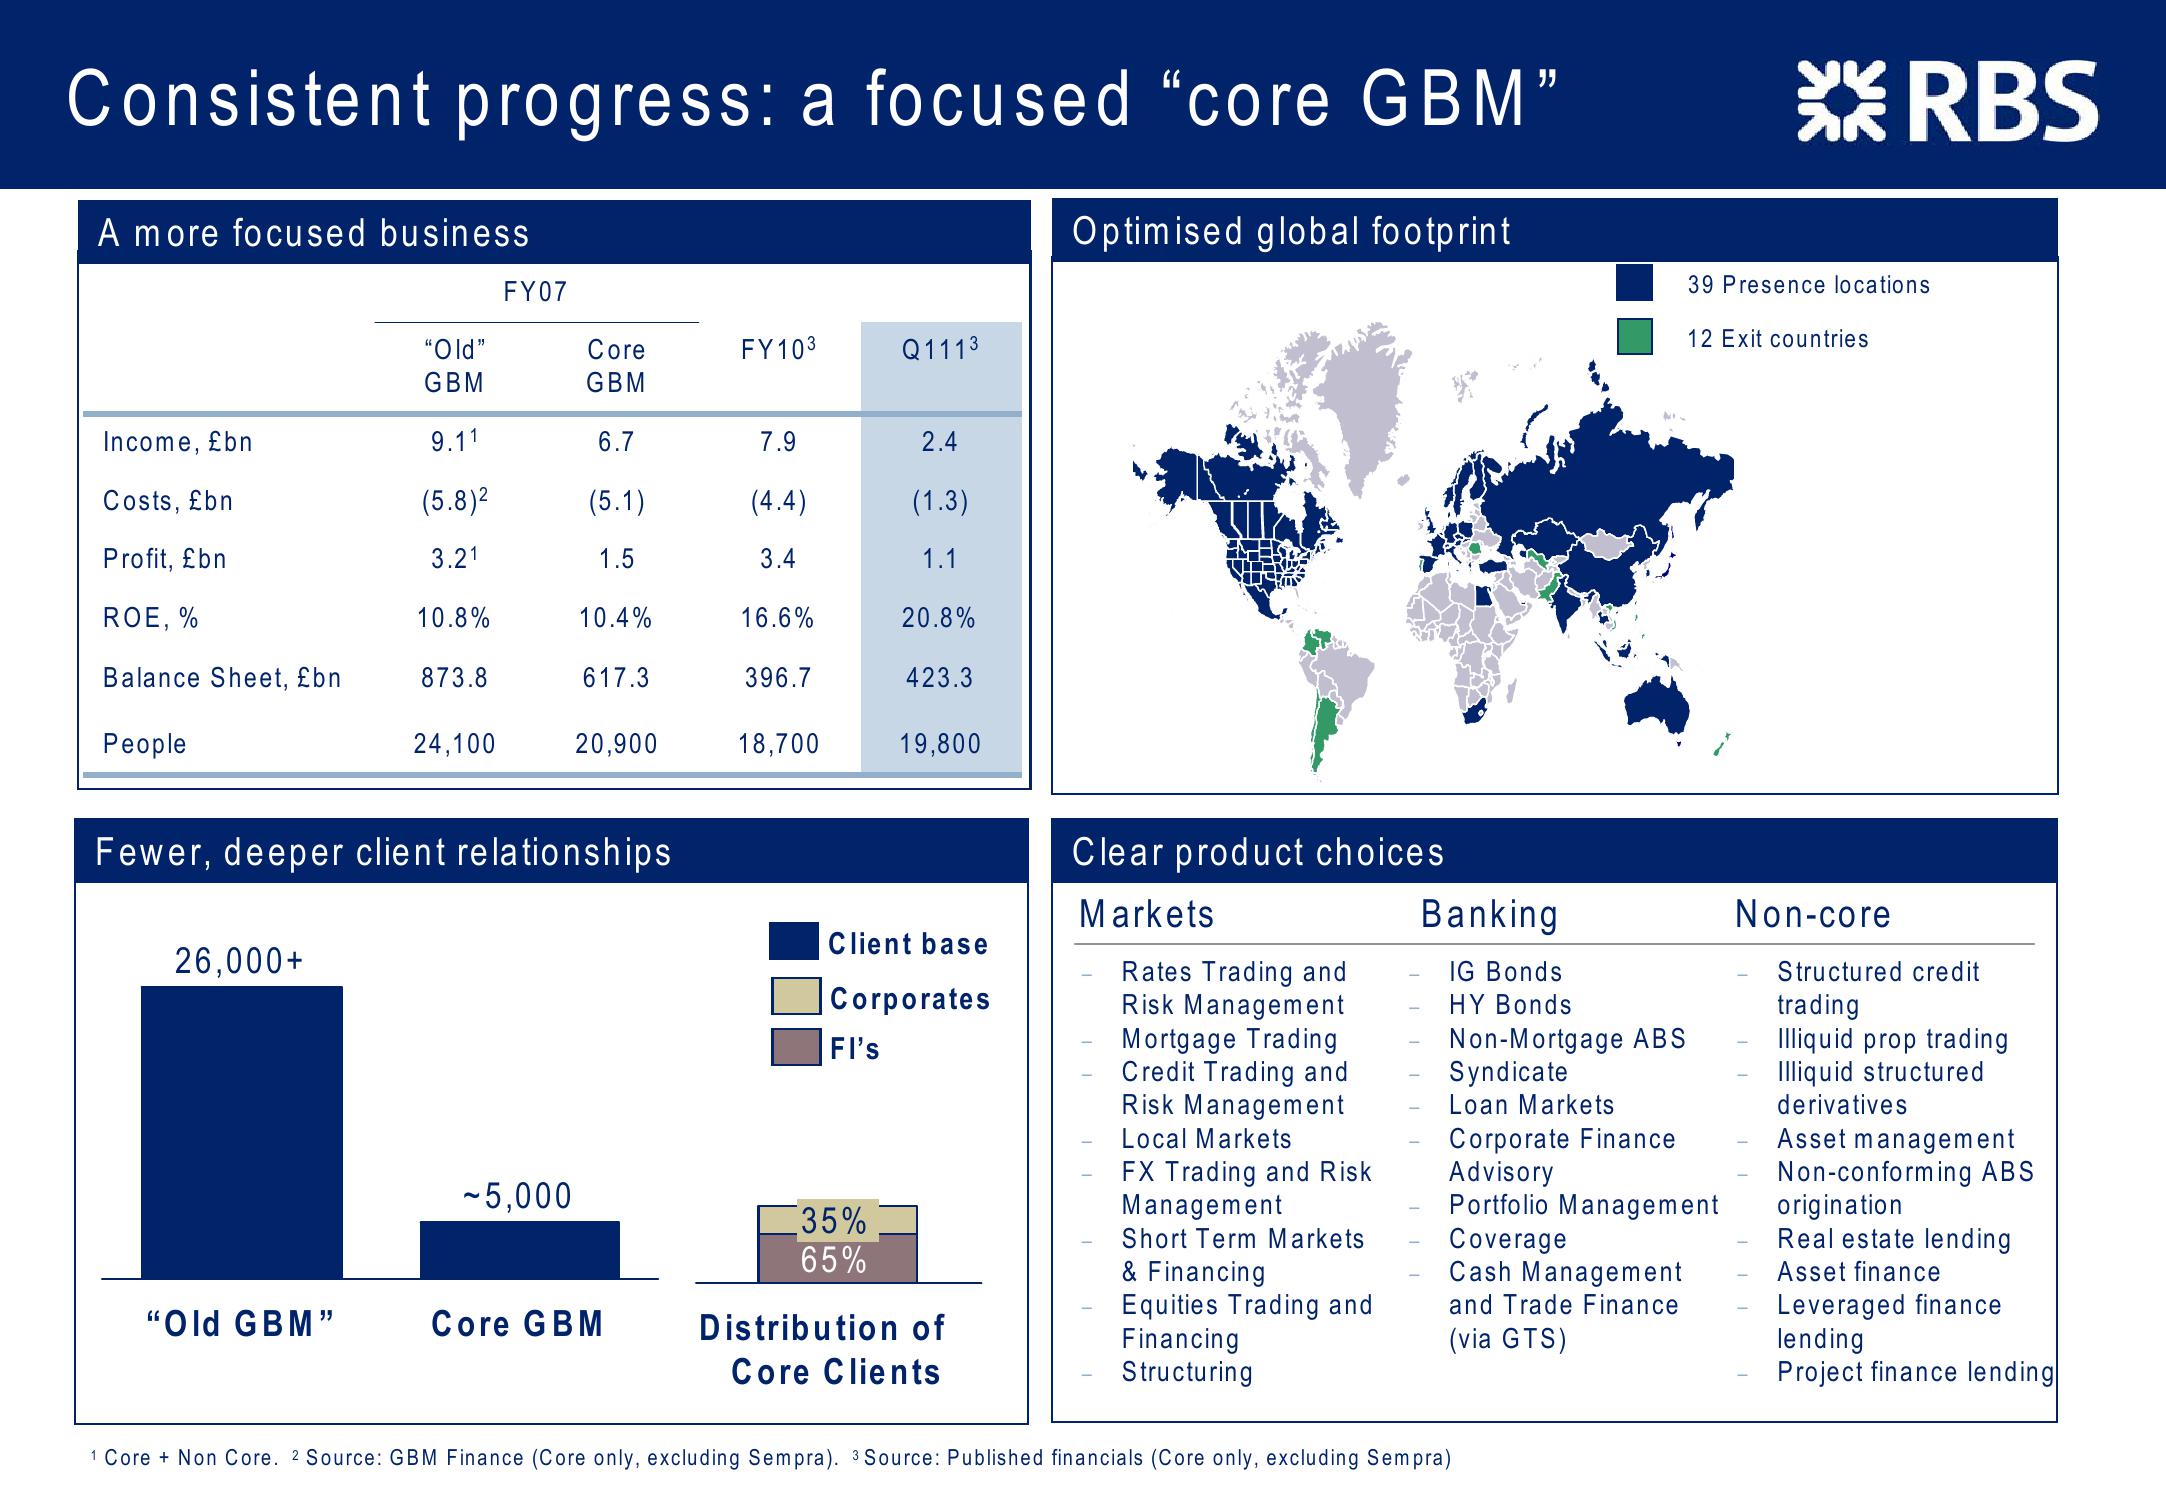
Consistent progress: a focused "core GBM"
A more focused business
FY07
"Old"
Core
FY103
Q1113
GBM
GBM
Income, £bn
9.11
6.7
7.9
2.4
Costs, £bn
(5.8)2
(5.1)
(4.4)
(1.3)
Profit, £bn
3.21
1.5
3.4
1.1
ROE, %
10.8%
10.4%
16.6%
20.8%
Balance Sheet, £bn
873.8
617.3
396.7
423.3
People
24,100
20,900
18,700
19,800
Fewer, deeper client relationships
26,000+
Client base
Corporates
FI's
~5,000
35%
65%
"Old GBM"
Core GBM
Distribution of
Core Clients
Optimised global footprint
RBS
39 Presence locations
12 Exit countries
Clear product choices
Markets
Rates Trading and
Risk Management
Mortgage Trading
Credit Trading and
Risk Management
Local Markets
FX Trading and Risk
Management
Short Term Markets
& Financing
Equities Trading and
Financing
Structuring
Banking
IG Bonds
HY Bonds
Non-Mortgage ABS
Syndicate
Loan Markets
Corporate Finance
Advisory
Portfolio Management
Coverage
Cash Management
and Trade Finance
(via GTS)
Non-core
Structured credit
trading
Illiquid prop trading
Illiquid structured
derivatives
Asset management
Non-conforming ABS
origination
Real estate lending
Asset finance
Leveraged finance
lending
Project finance lending
1 Core + Non Core. 2 Source: GBM Finance (Core only, excluding Sempra). 3 Source: Published financials (Core only, excluding Sempra)View entire presentation