Matson Results Presentation Deck
15
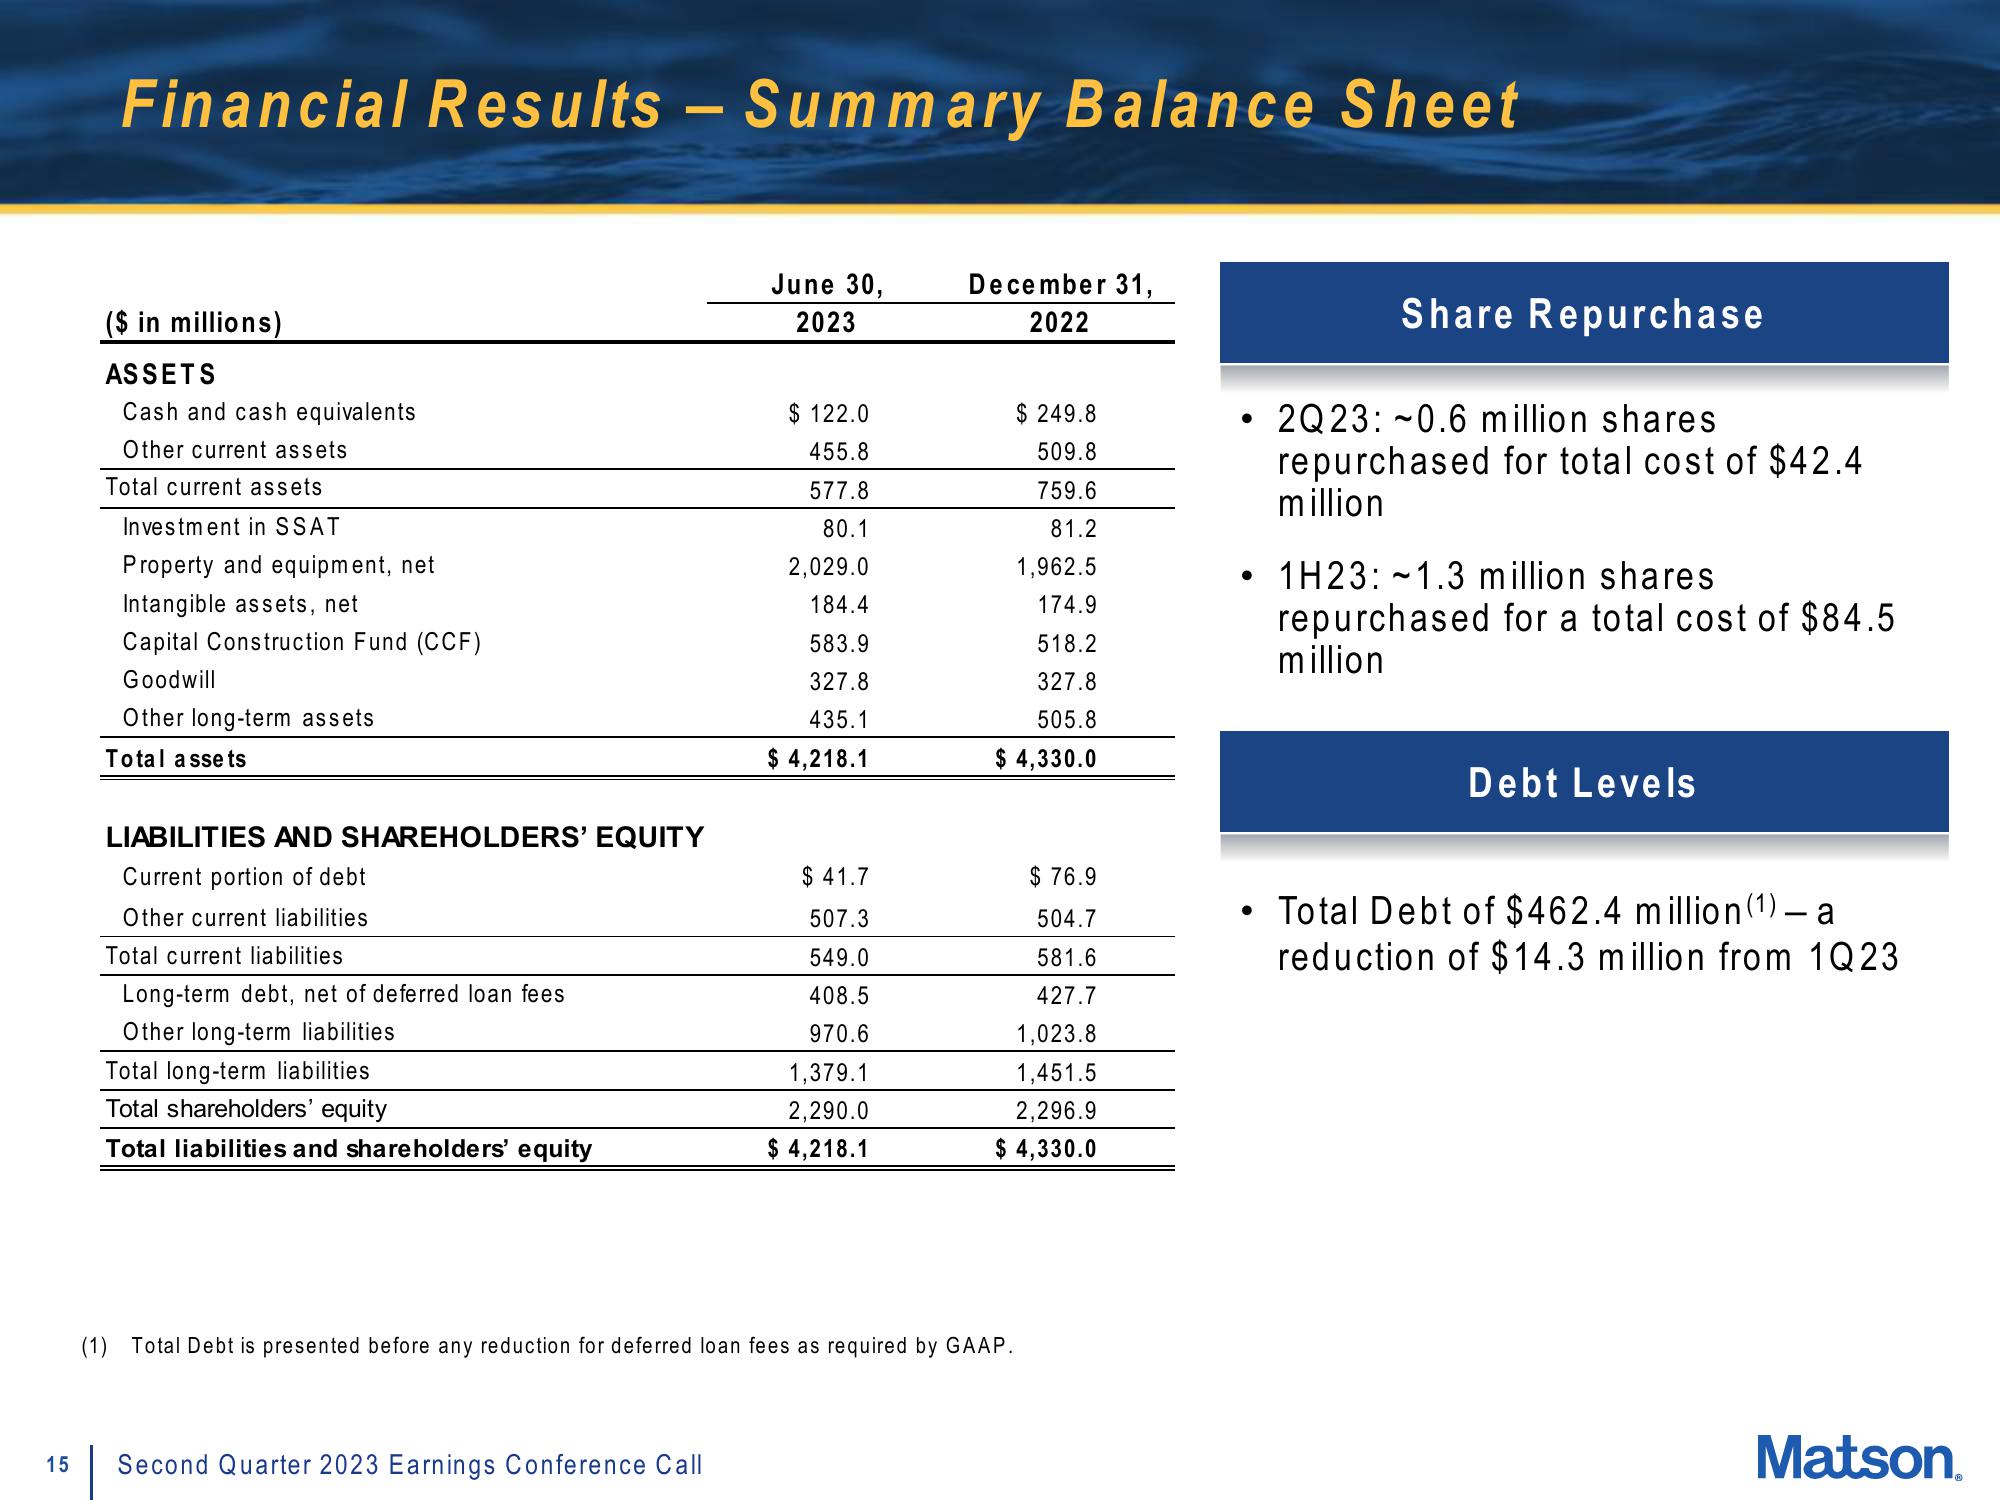
Financial Results - Summary Balance Sheet
($ in millions)
ASSETS
Cash and cash equivalents
Other current assets
Total current assets
Investment in SSAT
Property and equipment, net
Intangible assets, net
Capital Construction Fund (CCF)
Goodwill
Other long-term assets
Total assets
LIABILITIES AND SHAREHOLDERS' EQUITY
Current portion of debt
Other current liabilities
Total current liabilities
Long-term debt, net of deferred loan fees
Other long-term liabilities
Total long-term liabilities
Total shareholders' equity
Total liabilities and shareholders' equity
June 30,
2023
Second Quarter 2023 Earnings Conference Call
$122.0
455.8
577.8
80.1
2,029.0
184.4
583.9
327.8
435.1
$ 4,218.1
$41.7
507.3
549.0
408.5
970.6
1,379.1
2,290.0
$ 4,218.1
December 31,
2022
$249.8
509.8
759.6
81.2
1,962.5
174.9
518.2
327.8
505.8
$ 4,330.0
$76.9
504.7
581.6
427.7
1,023.8
1,451.5
2,296.9
$ 4,330.0
(1) Total Debt is presented before any reduction for deferred loan fees as required by GAAP.
●
Share Repurchase
2Q23: -0.6 million shares
repurchased for total cost of $42.4
million
1H23: 1.3 million shares
repurchased for a total cost of $84.5
million
~
Debt Levels
Total Debt of $462.4 million (1) - a
reduction of $14.3 million from 1Q23
Matson.View entire presentation