XP Inc Results Presentation Deck
Adjusted EBITDA and Margin
Operational Leverage despite investments in technology, client experience and product offering
Operating Expenses (in R$ mn)
SG&A¹
% of Net
Revenue
717
4Q20
29.9%
+38%
1,116
3Q21
35.2%
989
4Q21
30.3%
Highlights
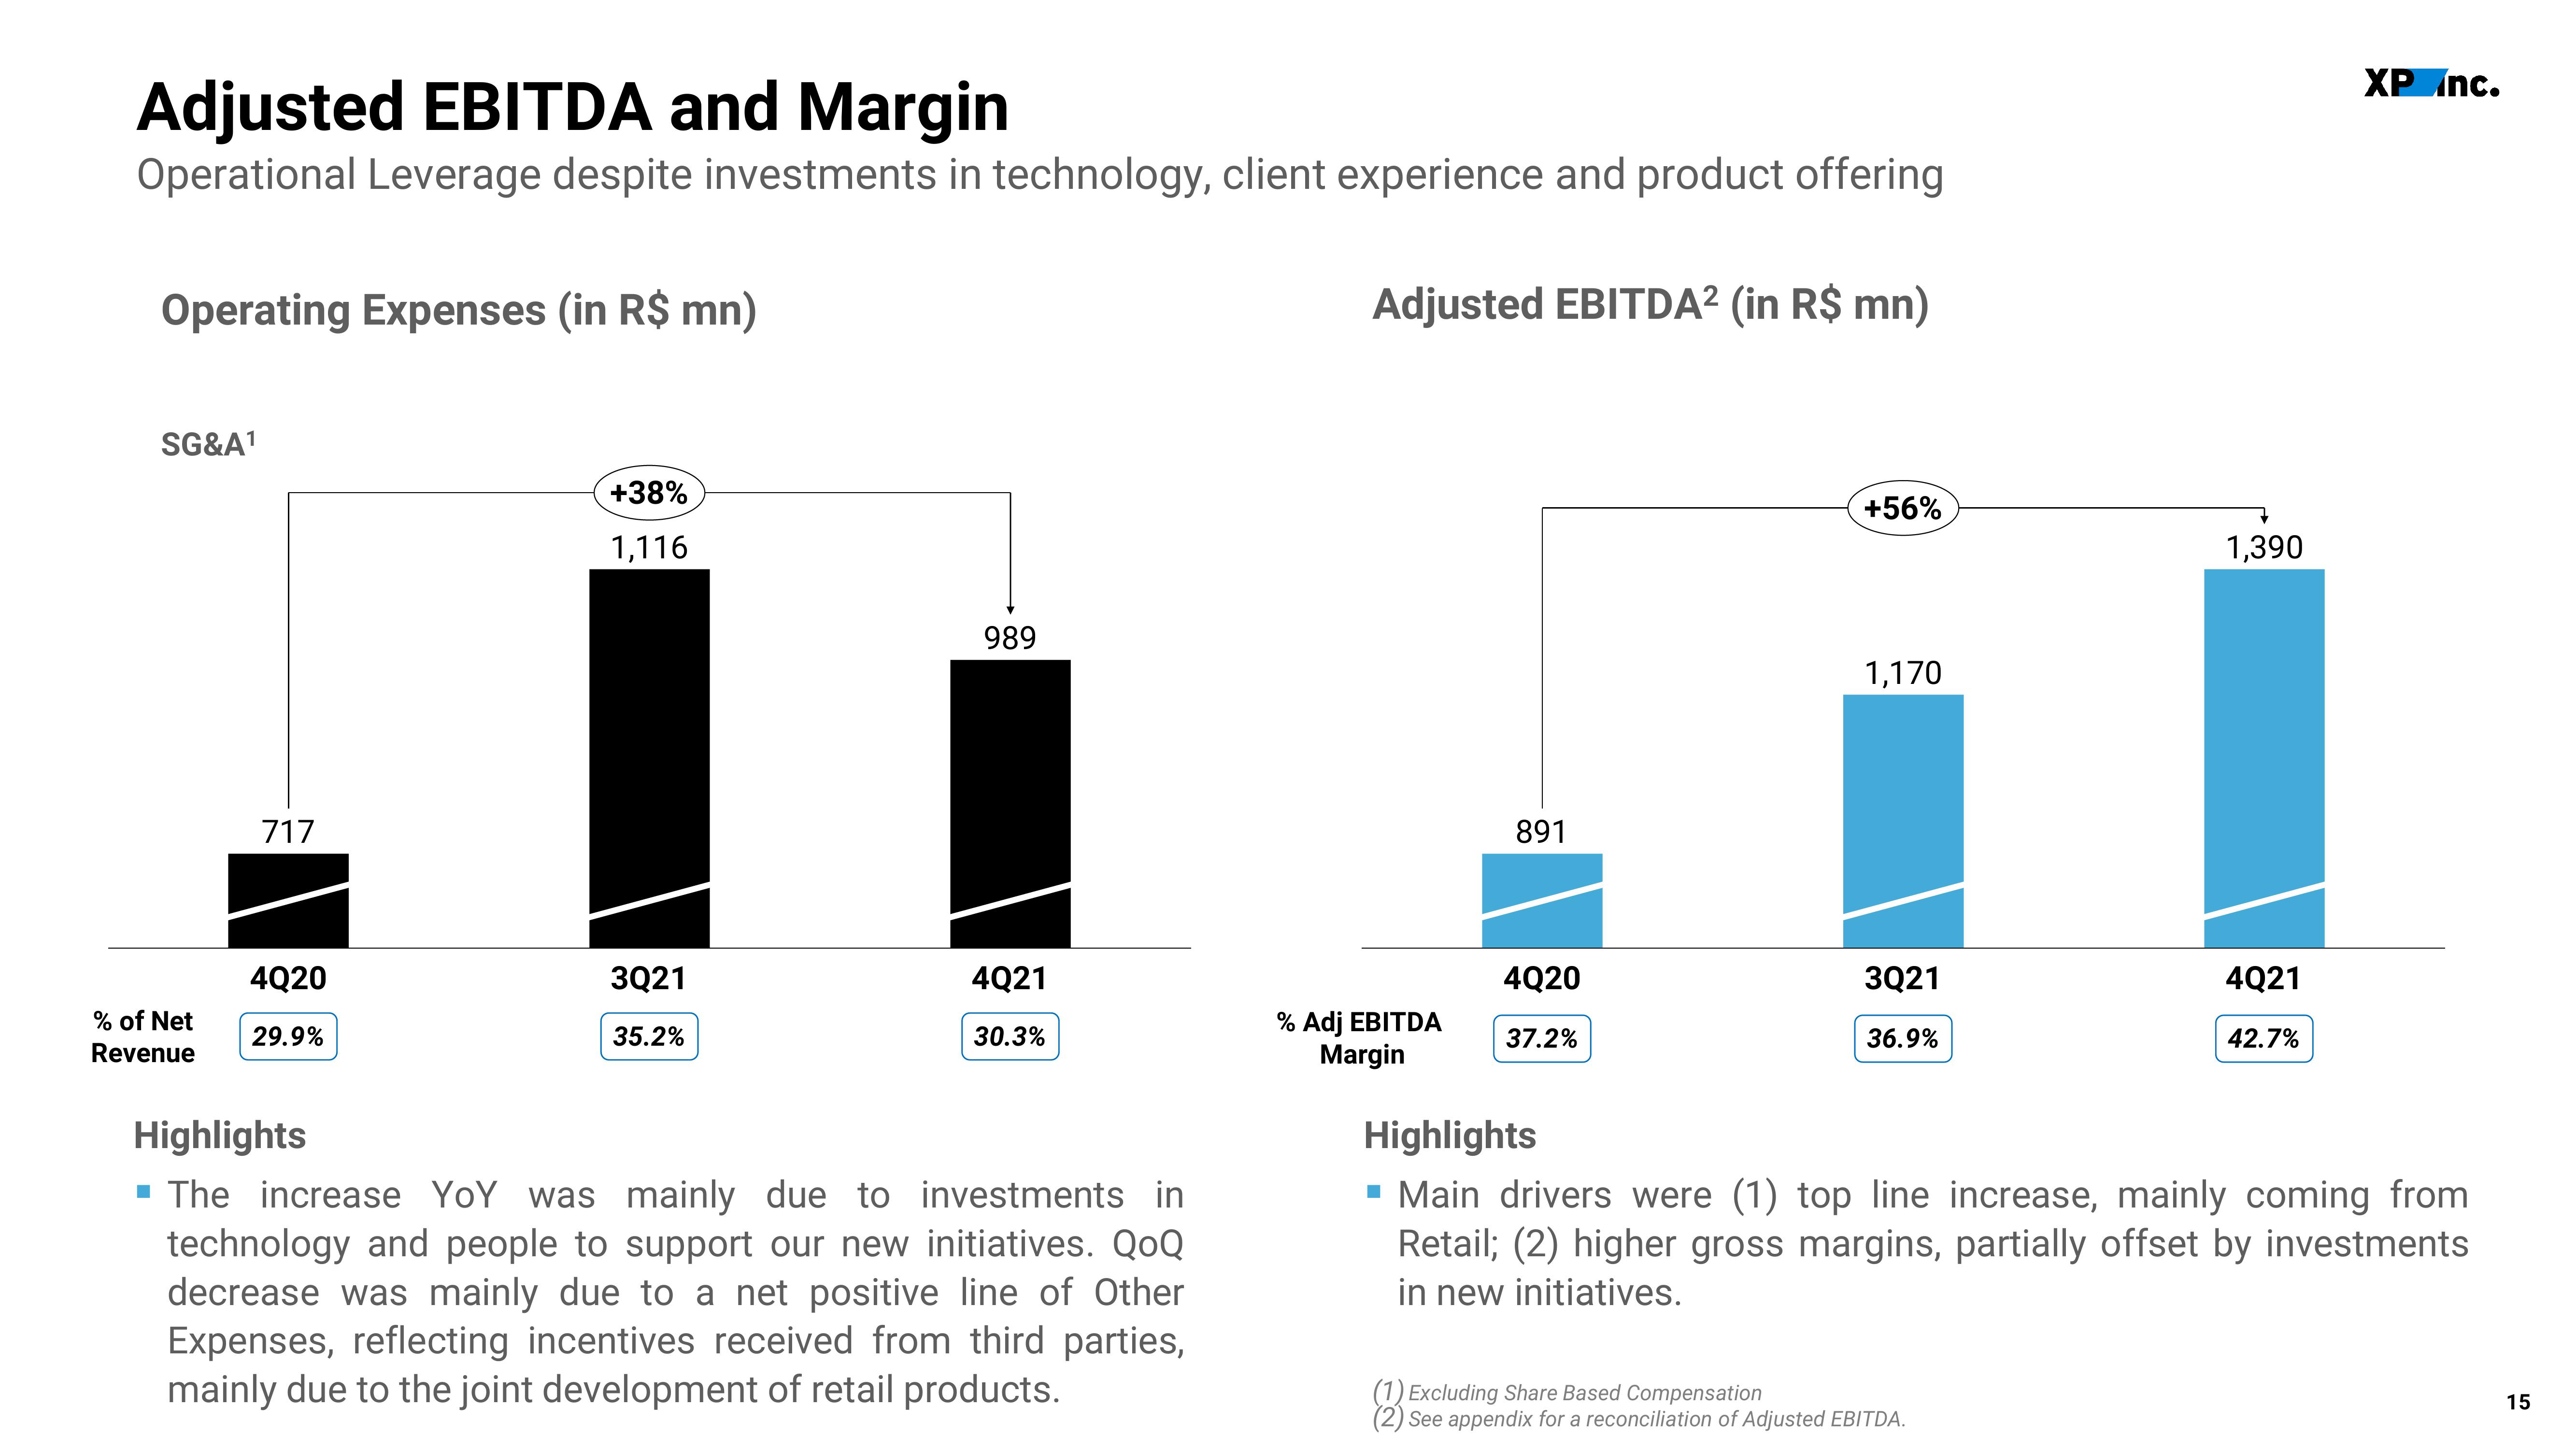
▪ The increase YoY was mainly due to investments in
technology and people to support our new initiatives. QoQ
decrease was mainly due to a net positive line of Other
Expenses, reflecting incentives received from third parties,
mainly due to the joint development of retail products.
Adjusted EBITDA² (in R$ mn)
% Adj EBITDA
Margin
891
4Q20
37.2%
+56%
1,170
3Q21
36.9%
1,390
Excluding Share Based Compensation
85
See appendix for a reconciliation of Adjusted EBITDA.
4Q21
42.7%
XP Inc.
Highlights
▪ Main drivers were (1) top line increase, mainly coming from
Retail; (2) higher gross margins, partially offset by investments
in new initiatives.
15View entire presentation