Azure Power Investor Presentation
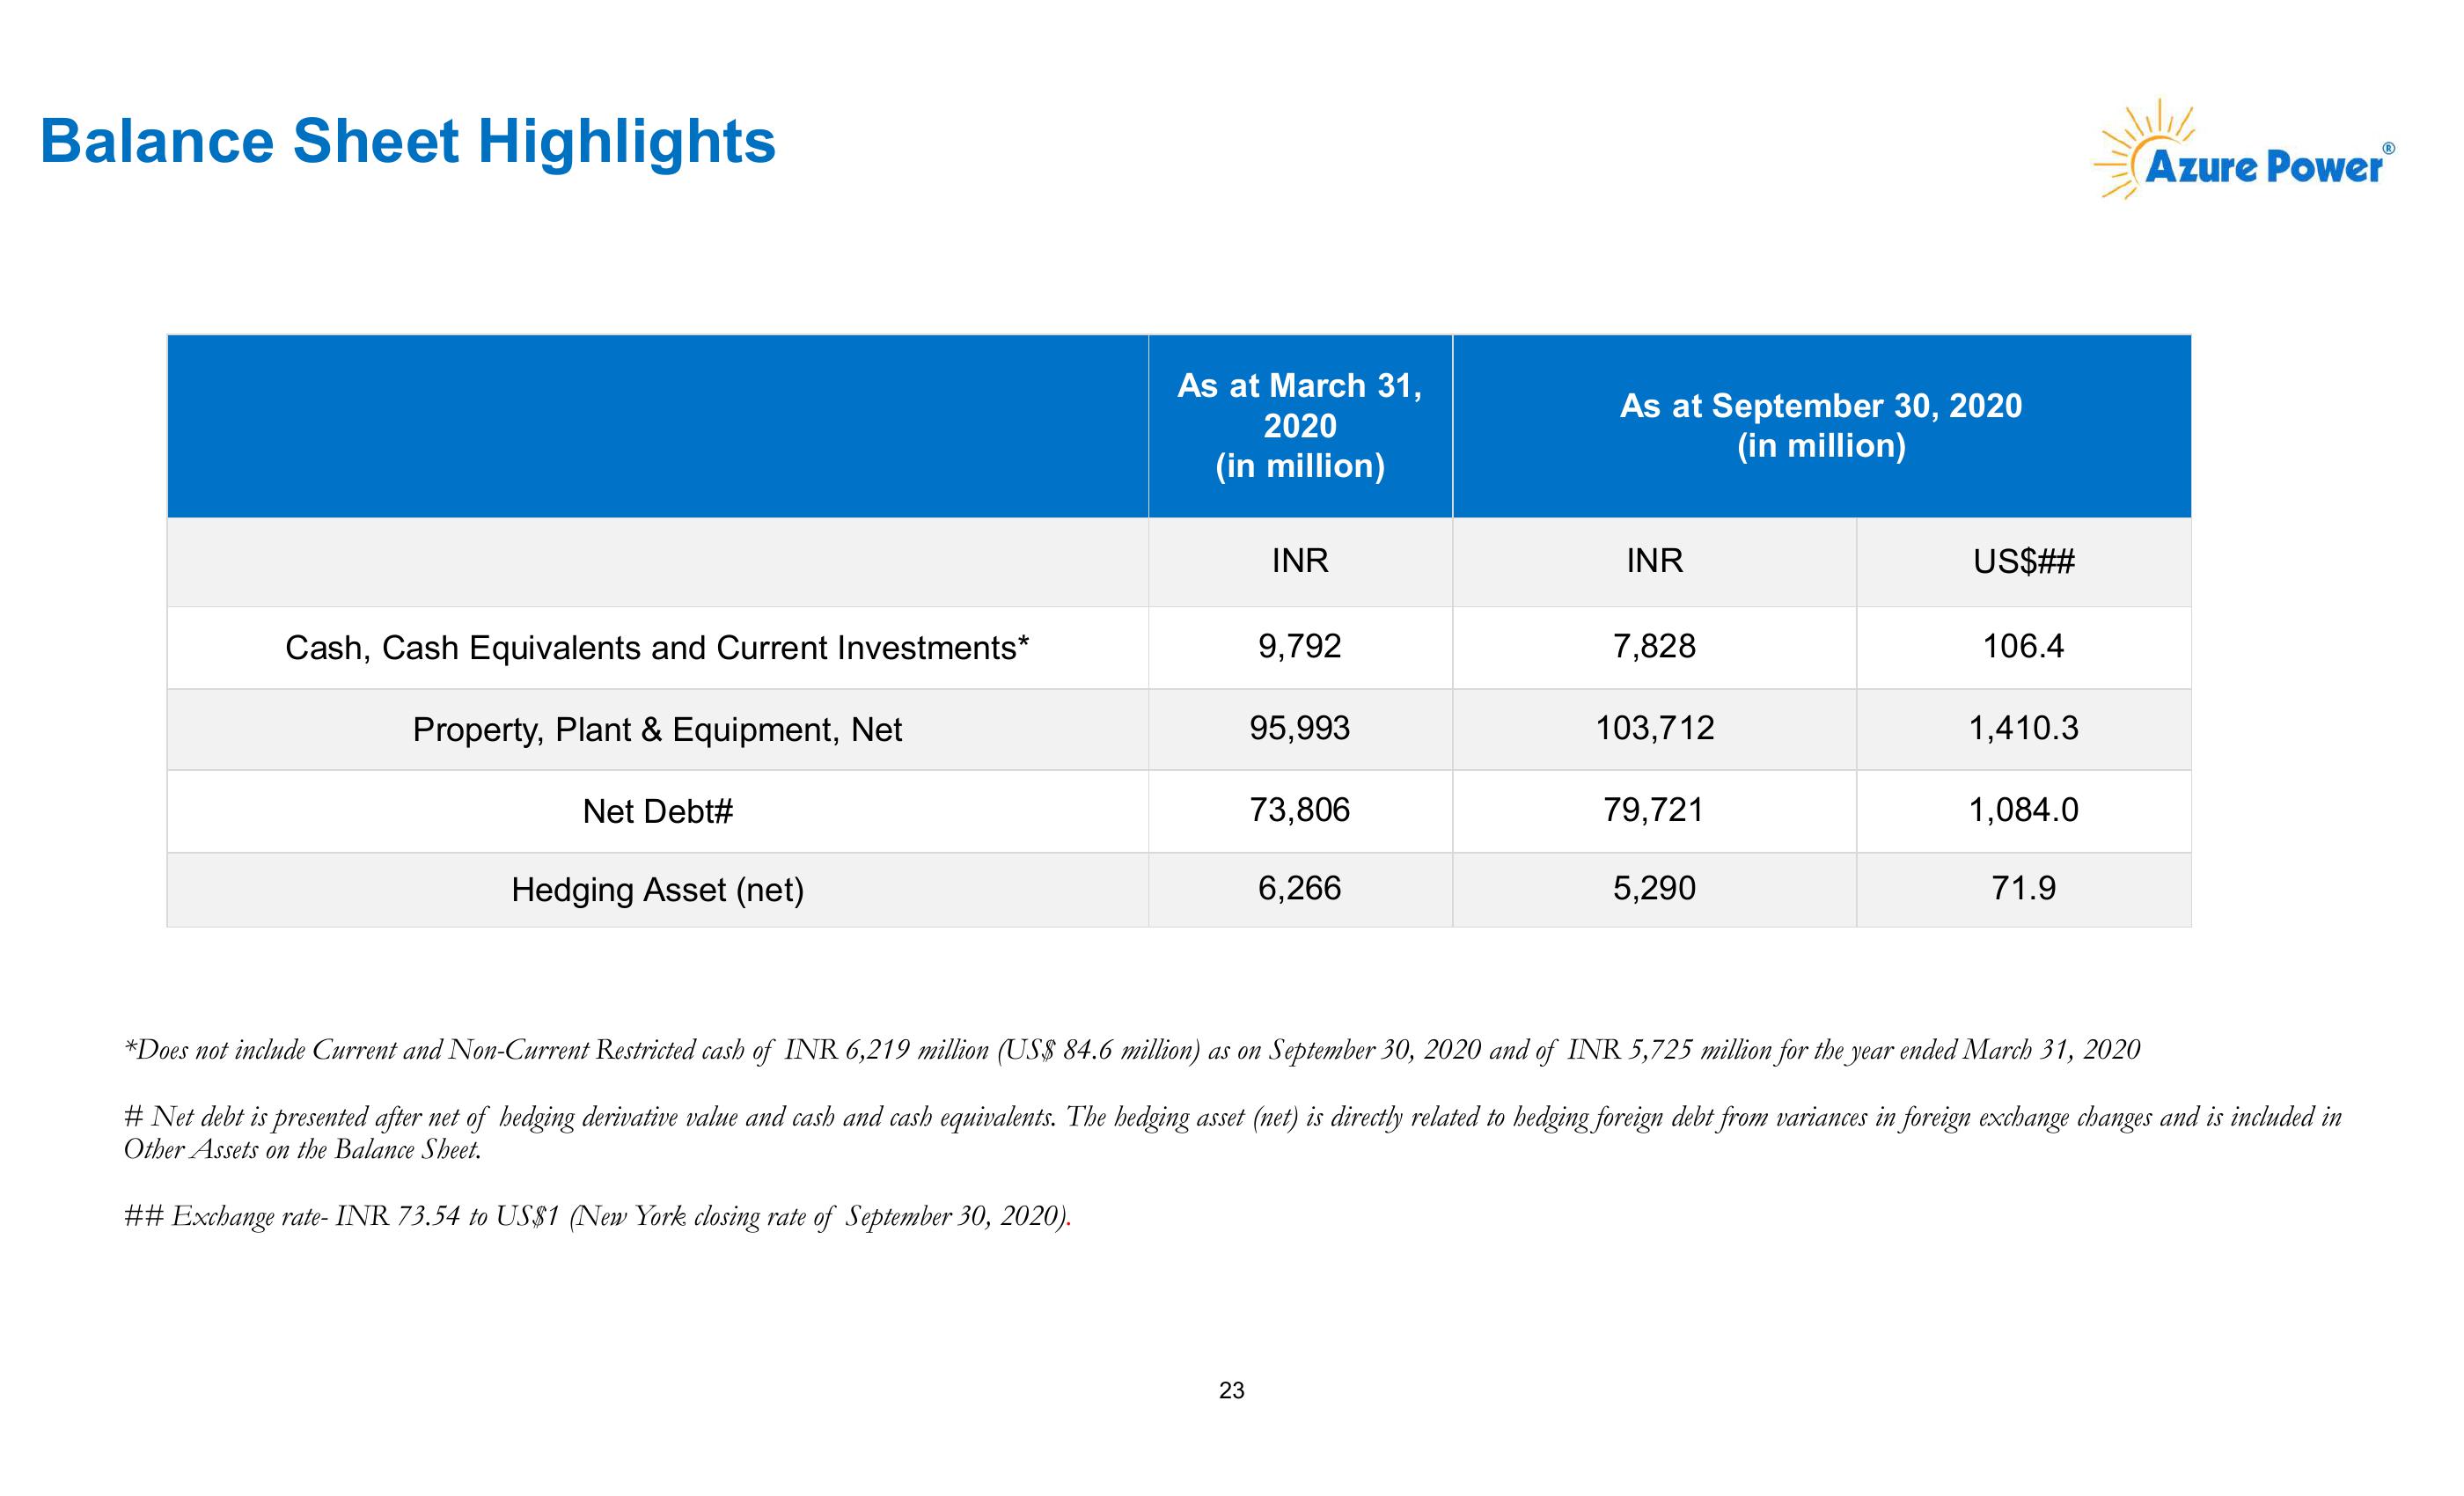
Balance Sheet Highlights
Cash, Cash Equivalents and Current Investments*
Property, Plant & Equipment, Net
Net Debt#
Hedging Asset (net)
As at March 31,
2020
(in million)
As at September 30, 2020
(in million)
Azure Power
INR
INR
US$##
9,792
7,828
106.4
95,993
103,712
1.410.3
73,806
79,721
1,084.0
6,266
5,290
71.9
*Does not include Current and Non-Current Restricted cash of INR 6,219 million (US$ 84.6 million) as on September 30, 2020 and of INR 5,725 million for the year ended March 31, 2020
# Net debt is presented after net of hedging derivative value and cash and cash equivalents. The hedging asset (net) is directly related to hedging foreign debt from variances in foreign exchange changes and is included in
Other Assets on the Balance Sheet.
## Exchange rate- INR 73.54 to US$1 (New York closing rate of September 30, 2020).
23
23View entire presentation