Ares US Real Estate Opportunity Fund III
AREOF II & Related Vehicles Portfolio Overview
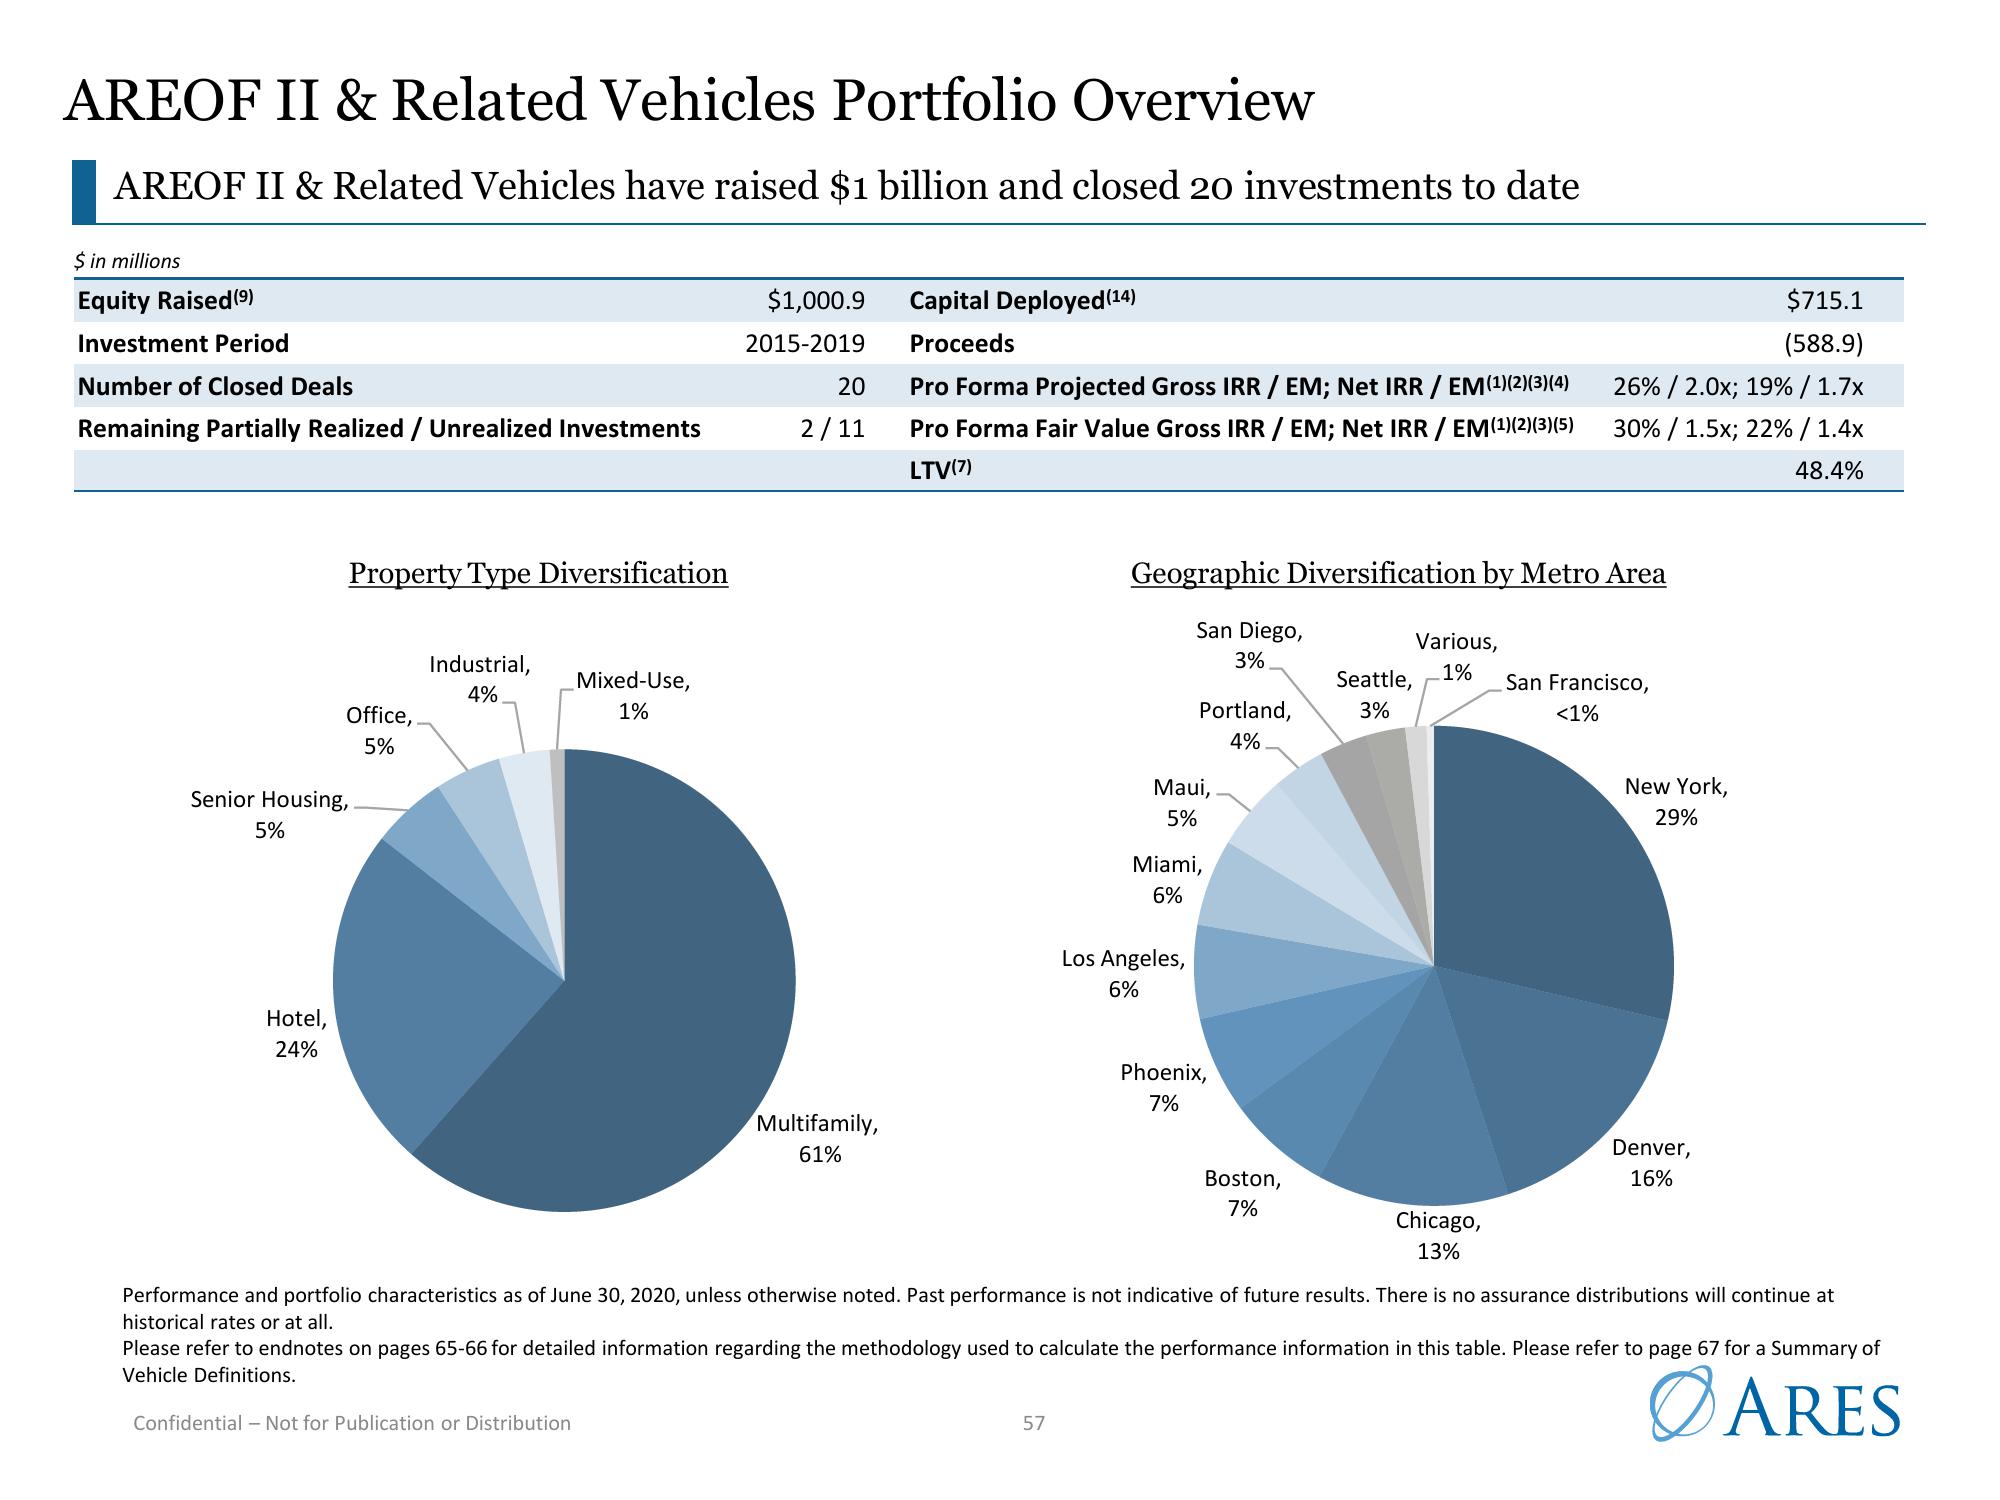
AREOF II & Related Vehicles have raised $1 billion and closed 20 investments to date
$ in millions
Equity Raised (⁹)
Investment Period
Number of Closed Deals
Remaining Partially Realized / Unrealized Investments
5%
Property Type Diversification
Senior Housing,
Hotel,
24%
Office,
5%
Industrial,
4%
Mixed-Use,
1%
$1,000.9
2015-2019
Confidential - Not for Publication or Distribution
20
2/11
Multifamily,
61%
Capital Deployed (14)
Proceeds
Pro Forma Projected Gross IRR / EM; Net IRR / EM (1)(2)(3)(4)
Pro Forma Fair Value Gross IRR / EM; Net IRR / EM (1)(2)(3)(5)
LTV(7)
Geographic Diversification by Metro Area
San Diego,
3%
57
Portland,
4%
Maui,
5%
Miami,
6%
Los Angeles,
6%
Phoenix,
7%
Boston,
7%
$715.1
(588.9)
26% / 2.0x; 19% / 1.7x
30% / 1.5x; 22% / 1.4x
48.4%
Various,
Seattle, 1% San Francisco,
3%
<1%
Chicago,
13%
New York,
29%
Performance and portfolio characteristics as of June 30, 2020, unless otherwise noted. Past performance is not indicative of future results. There is no assurance distributions will continue at
historical rates or at all.
Denver,
16%
Please refer to endnotes on pages 65-66 for detailed information regarding the methodology used to calculate the performance information in this table. Please refer to page 67 for a Summary of
Vehicle Definitions.
ARESView entire presentation