Dutch Bros Results Presentation Deck
($ in millions)
Company-operated shop revenue
COMPANY-OPERATED SHOP RESULTS
Beverage, food and packaging
Labor costs
1
Occupancy and other costs
Pre-opening costs
Depreciation and amortization
Company-operated shop gross profit
Depreciation and amortization
Company-operated shop contribution ²
LA
Three Months Ended December 31,
2022
175.5
45.6
44.9
31.2
3.8
11.2
38.8
11.2
50.0
%
100.0
9
26.0
25.5
17.8
2.2
6.4
22.1
6.4
28.5
$
2021 1
114.2
30.7
34.5
21.1
6.2
5.3
16.6
5.3
21.8
%
100.0 $
26.8
30.2
18.5
5.4
4.6
14.5
4.6
19.1
$
2022
639.7
171.9
182.9
109.4
18.0
36.3
121.3
36.3
Year Ended December 31,
157.6
%
100.0 $
26.9
28.6
17.1
2.8
5.6
19.0
5.6
24.6 $
$
2021
403.7
102.2
122.2
63.6
12.8
16.3
86.7
16.3
103.0
%
100.0
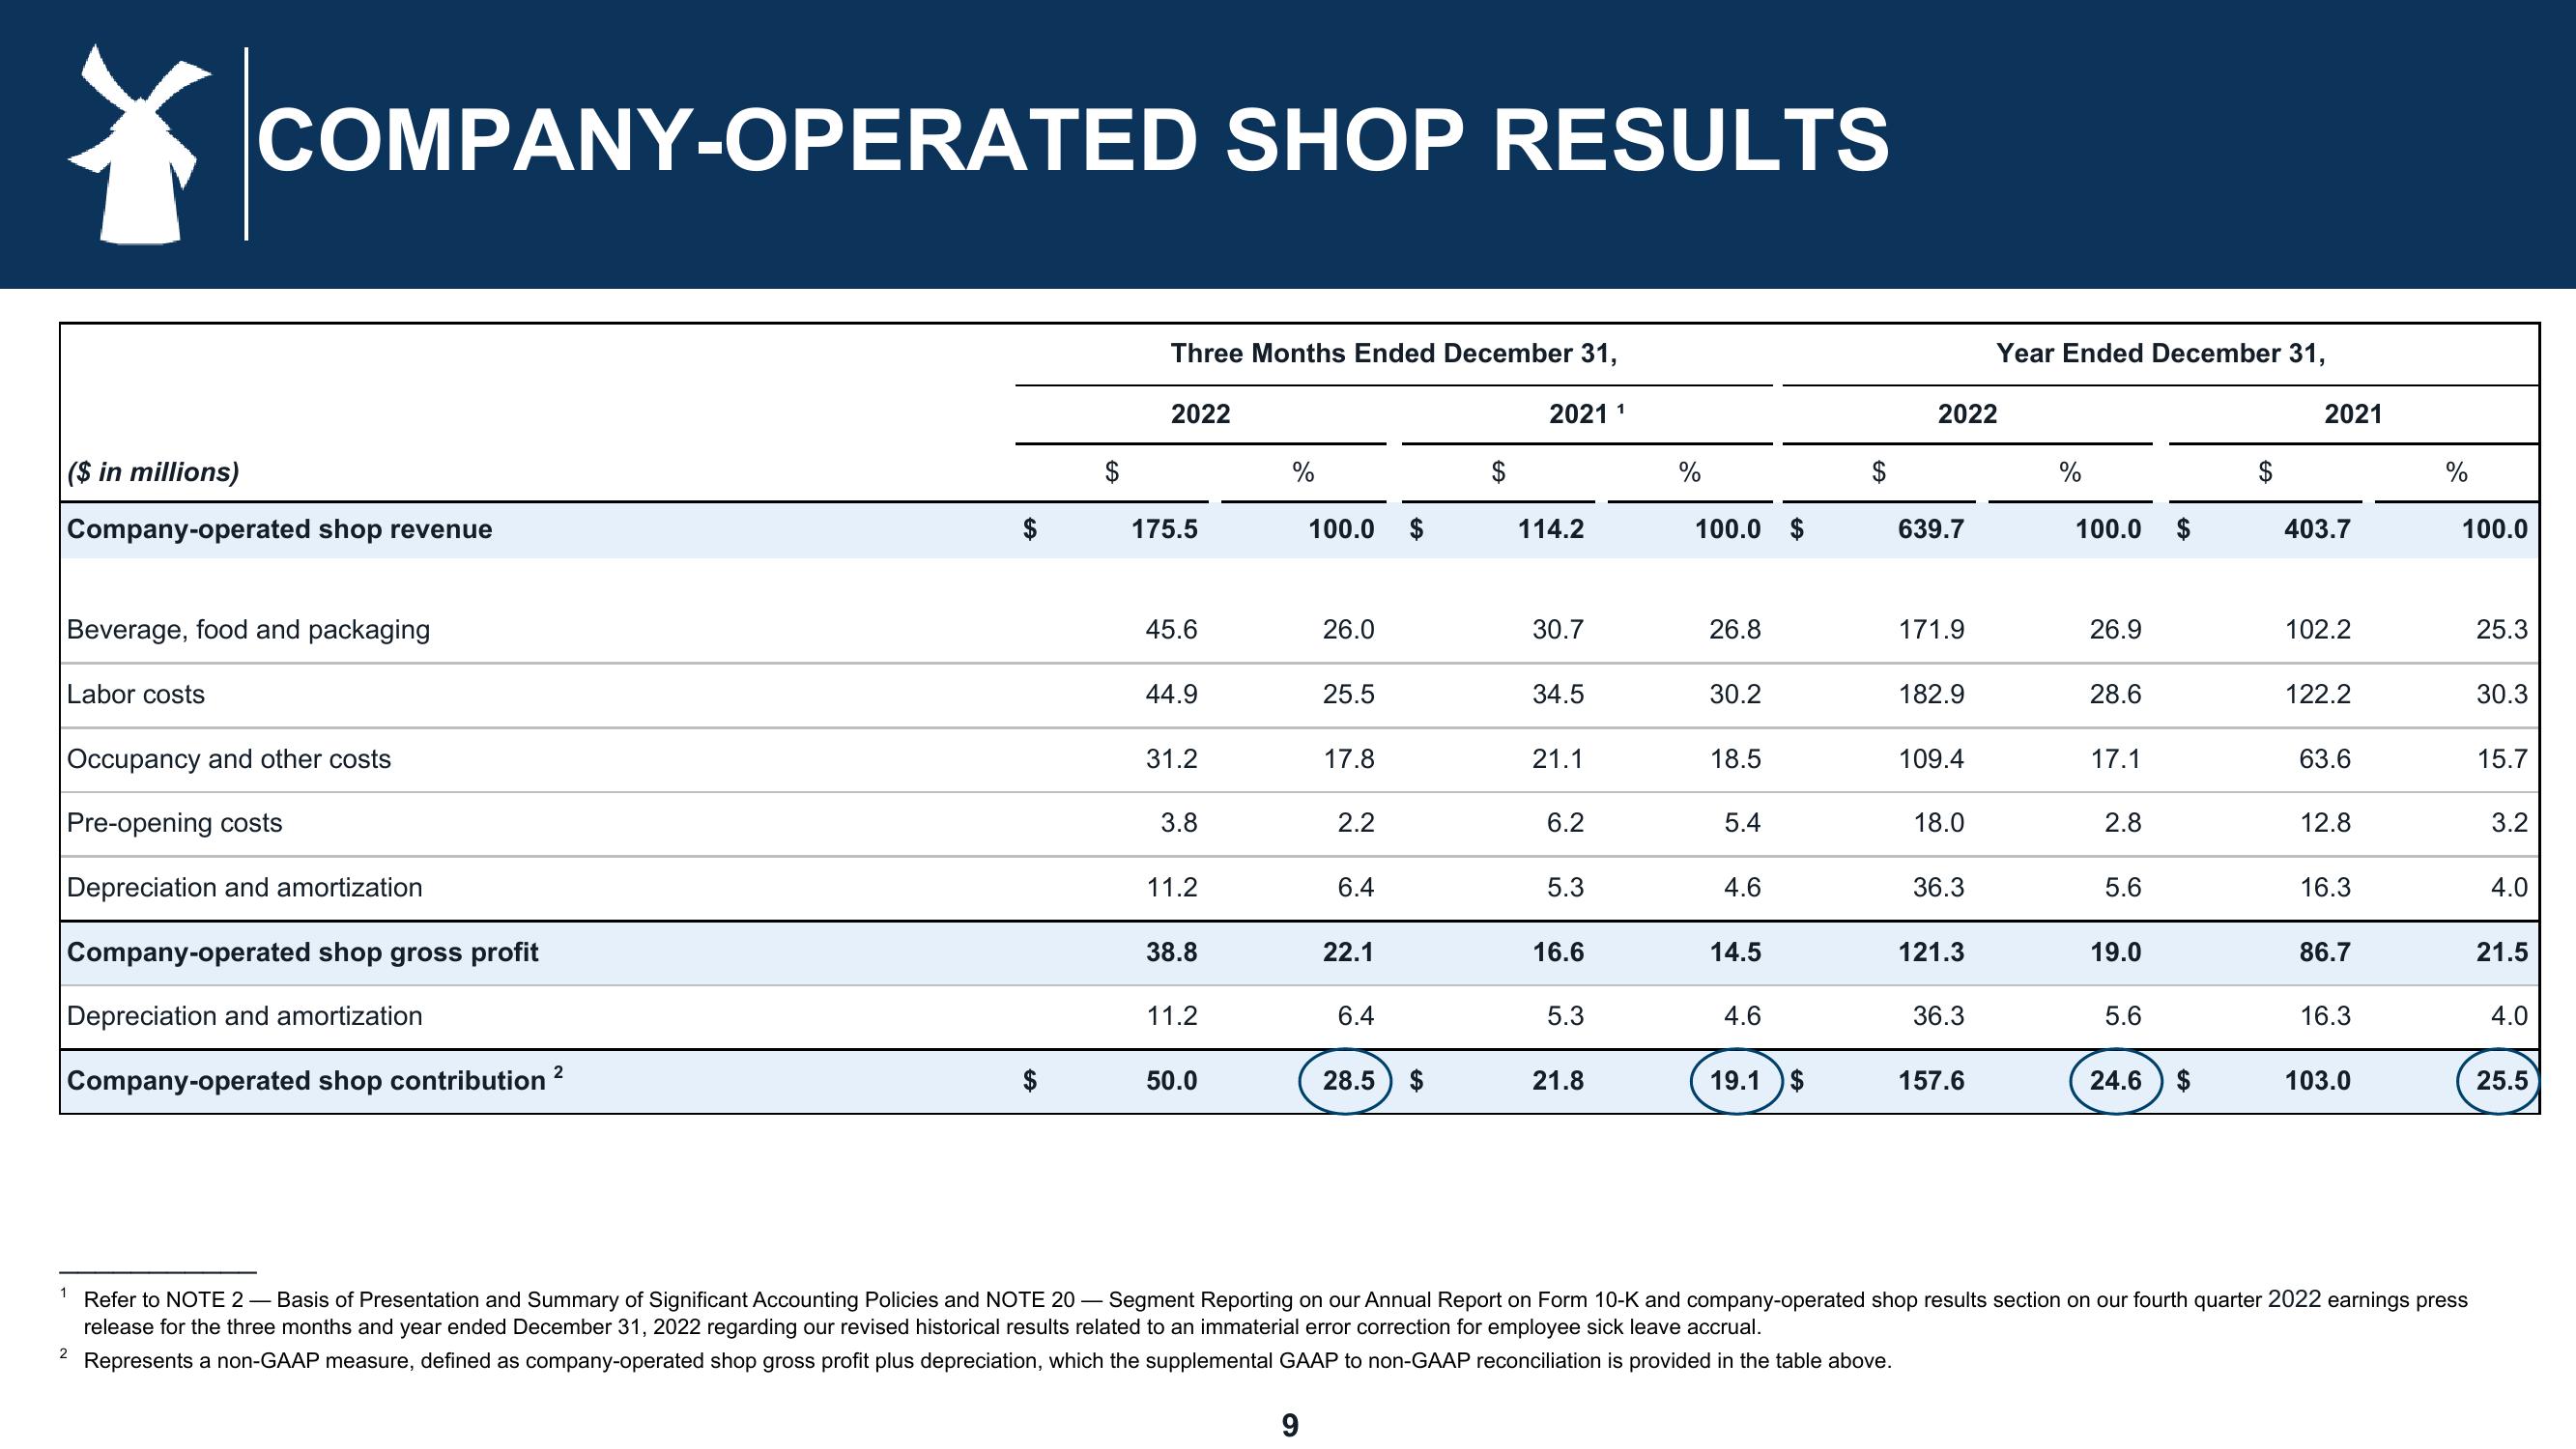
Refer to NOTE 2 - Basis of Presentation and Summary of Significant Accounting Policies and NOTE 20-Segment Reporting on our Annual Report on Form 10-K and company-operated shop results section on our fourth quarter 2022 earnings press
release for the three months and year ended December 31, 2022 regarding our revised historical results related to an immaterial error correction for employee sick leave accrual.
2 Represents a non-GAAP measure, defined as company-operated shop gross profit plus depreciation, which the supplemental GAAP to non-GAAP reconciliation is provided in the table above.
25.3
30.3
15.7
3.2
4.0
21.5
4.0
25.5View entire presentation