J.P.Morgan Results Presentation Deck
JPMORGAN CHASE & CO.
CORPORATE & INVESTMENT BANK
FINANCIAL HIGHLIGHTS
(in millions, except ratio data)
INCOME STATEMENT
REVENUE
Investment banking fees
Principal transactions
Lending- and deposit-related fees
Asset management, administration and commissions
All other income
Noninterest revenue
Net interest income
TOTAL NET REVENUE (a)
Provision for credit losses
NONINTEREST EXPENSE
Compensation expense
Noncompensation expense
TOTAL NONINTEREST EXPENSE
Income before income tax expense
Income tax expense (b)
NET INCOME (b)
FINANCIAL RATIOS
ROE
Overhead ratio
Compensation expense
REVENUE BY BUSINESS
Investment Banking
Payments
Lending
Total Banking
Fixed Income Markets
Equity Markets
Securities Services
percentage of total net revenue
Credit Adjustments & Other (c)
Total Markets & Securities Services
TOTAL NET REVENUE
$
$
$
3Q22
1,762
5,258
589
1,198
424
9,231
2,644
11,875
513
3,311
3,307
6,618
4,744
1,212
3,532
13%
56
28
1,713
1,989
323
4,025
4,469
2,302
1,110
(31)
7,850
11,875
$
2Q22
$
1,650
5,048
641
1,330
80
8,749
3,198
11,947
59
3,510
3,235
6,745
5,143
1,418
$ 3,725
14 %
56
29
1,351
1,463
410
3,224
4,711
3,079
1,151
(218)
8,723
$ 11,947
$
1Q22
2,050
5,223
641
1,339
704
9,957
3,572
13,529
445
4,006
3,292
7,298
5,786
1,401
$ 4,385
17%
54
30
2,057
1,854
321
4,232
5,698
3,055
1,068
(524)
QUARTERLY TRENDS
9,297
$ 13,529
$
$
$
4Q21
3,502
2,116
654
1,252
624
8,148
3,386
11,534
(126)
2,358
3,469
5,827
5,833
1,290
4,543
21% (b)
51
20
3,206
1,801
263
5,270
3,334
1,954
1,064
(88)
6,264
$ 11,534
$
3Q21
3,297
3,577
634
1,240
313
9,061
3,335
12,396
(638)
2,827
3,044
5,871
7,163
1,516
$ 5,647
26 %
47
23
$ 3,025
1,624
244
4,893
3,672
2,597
1,126
108
7,503
$ 12,396
3Q22 Change
2Q22
7%
4
(8)
(10)
430
6
(17)
(1)
NM
(6)
2
(2)
(8)
(15)
(5)
27
36
(21)
25
(5)
(25)
(4)
86
(10)
(1)
JPMORGAN CHASE & CO.
3Q21
(47)%
47
(7)
(3)
35
2
(21)
(4)
NM
17
9
13
(34)
(20)
(37)
(43)
22
32
(18)
22
(11)
(1)
NM
5
(4)
$
NINE MONTHS ENDED SEPTEMBER 30,
$
2022
5,462
15,529
1,871
3,867
1,208
27,937
9,414
37,351
1,017
10,827
9,834
20,661
15,673
4,031
$ 11,642
14 %
55
29
5,121
5,306
1,054
11,481
14,878
8,436
3,329
(773)
25,870
$ 37,351
$
$
$
2021
9,857
13,648
1,860
3,772
924
30,061
10,154
40,215
(1,048)
10,738
8,760
19,498
21,765
5,174
16,591
26% (b)
48
27
9,300
4,469
738
14,507
13,531
8,575
3,264
338
25,708
$ 40,215
2022 Change
2021
(45)%
14
1
3
31
(7)
(7)
(7)
NM
1
12
6
(28)
(22)
(30)
(45)
19
43
SNN
(21)
10
(2)
2
NM
1
(7)
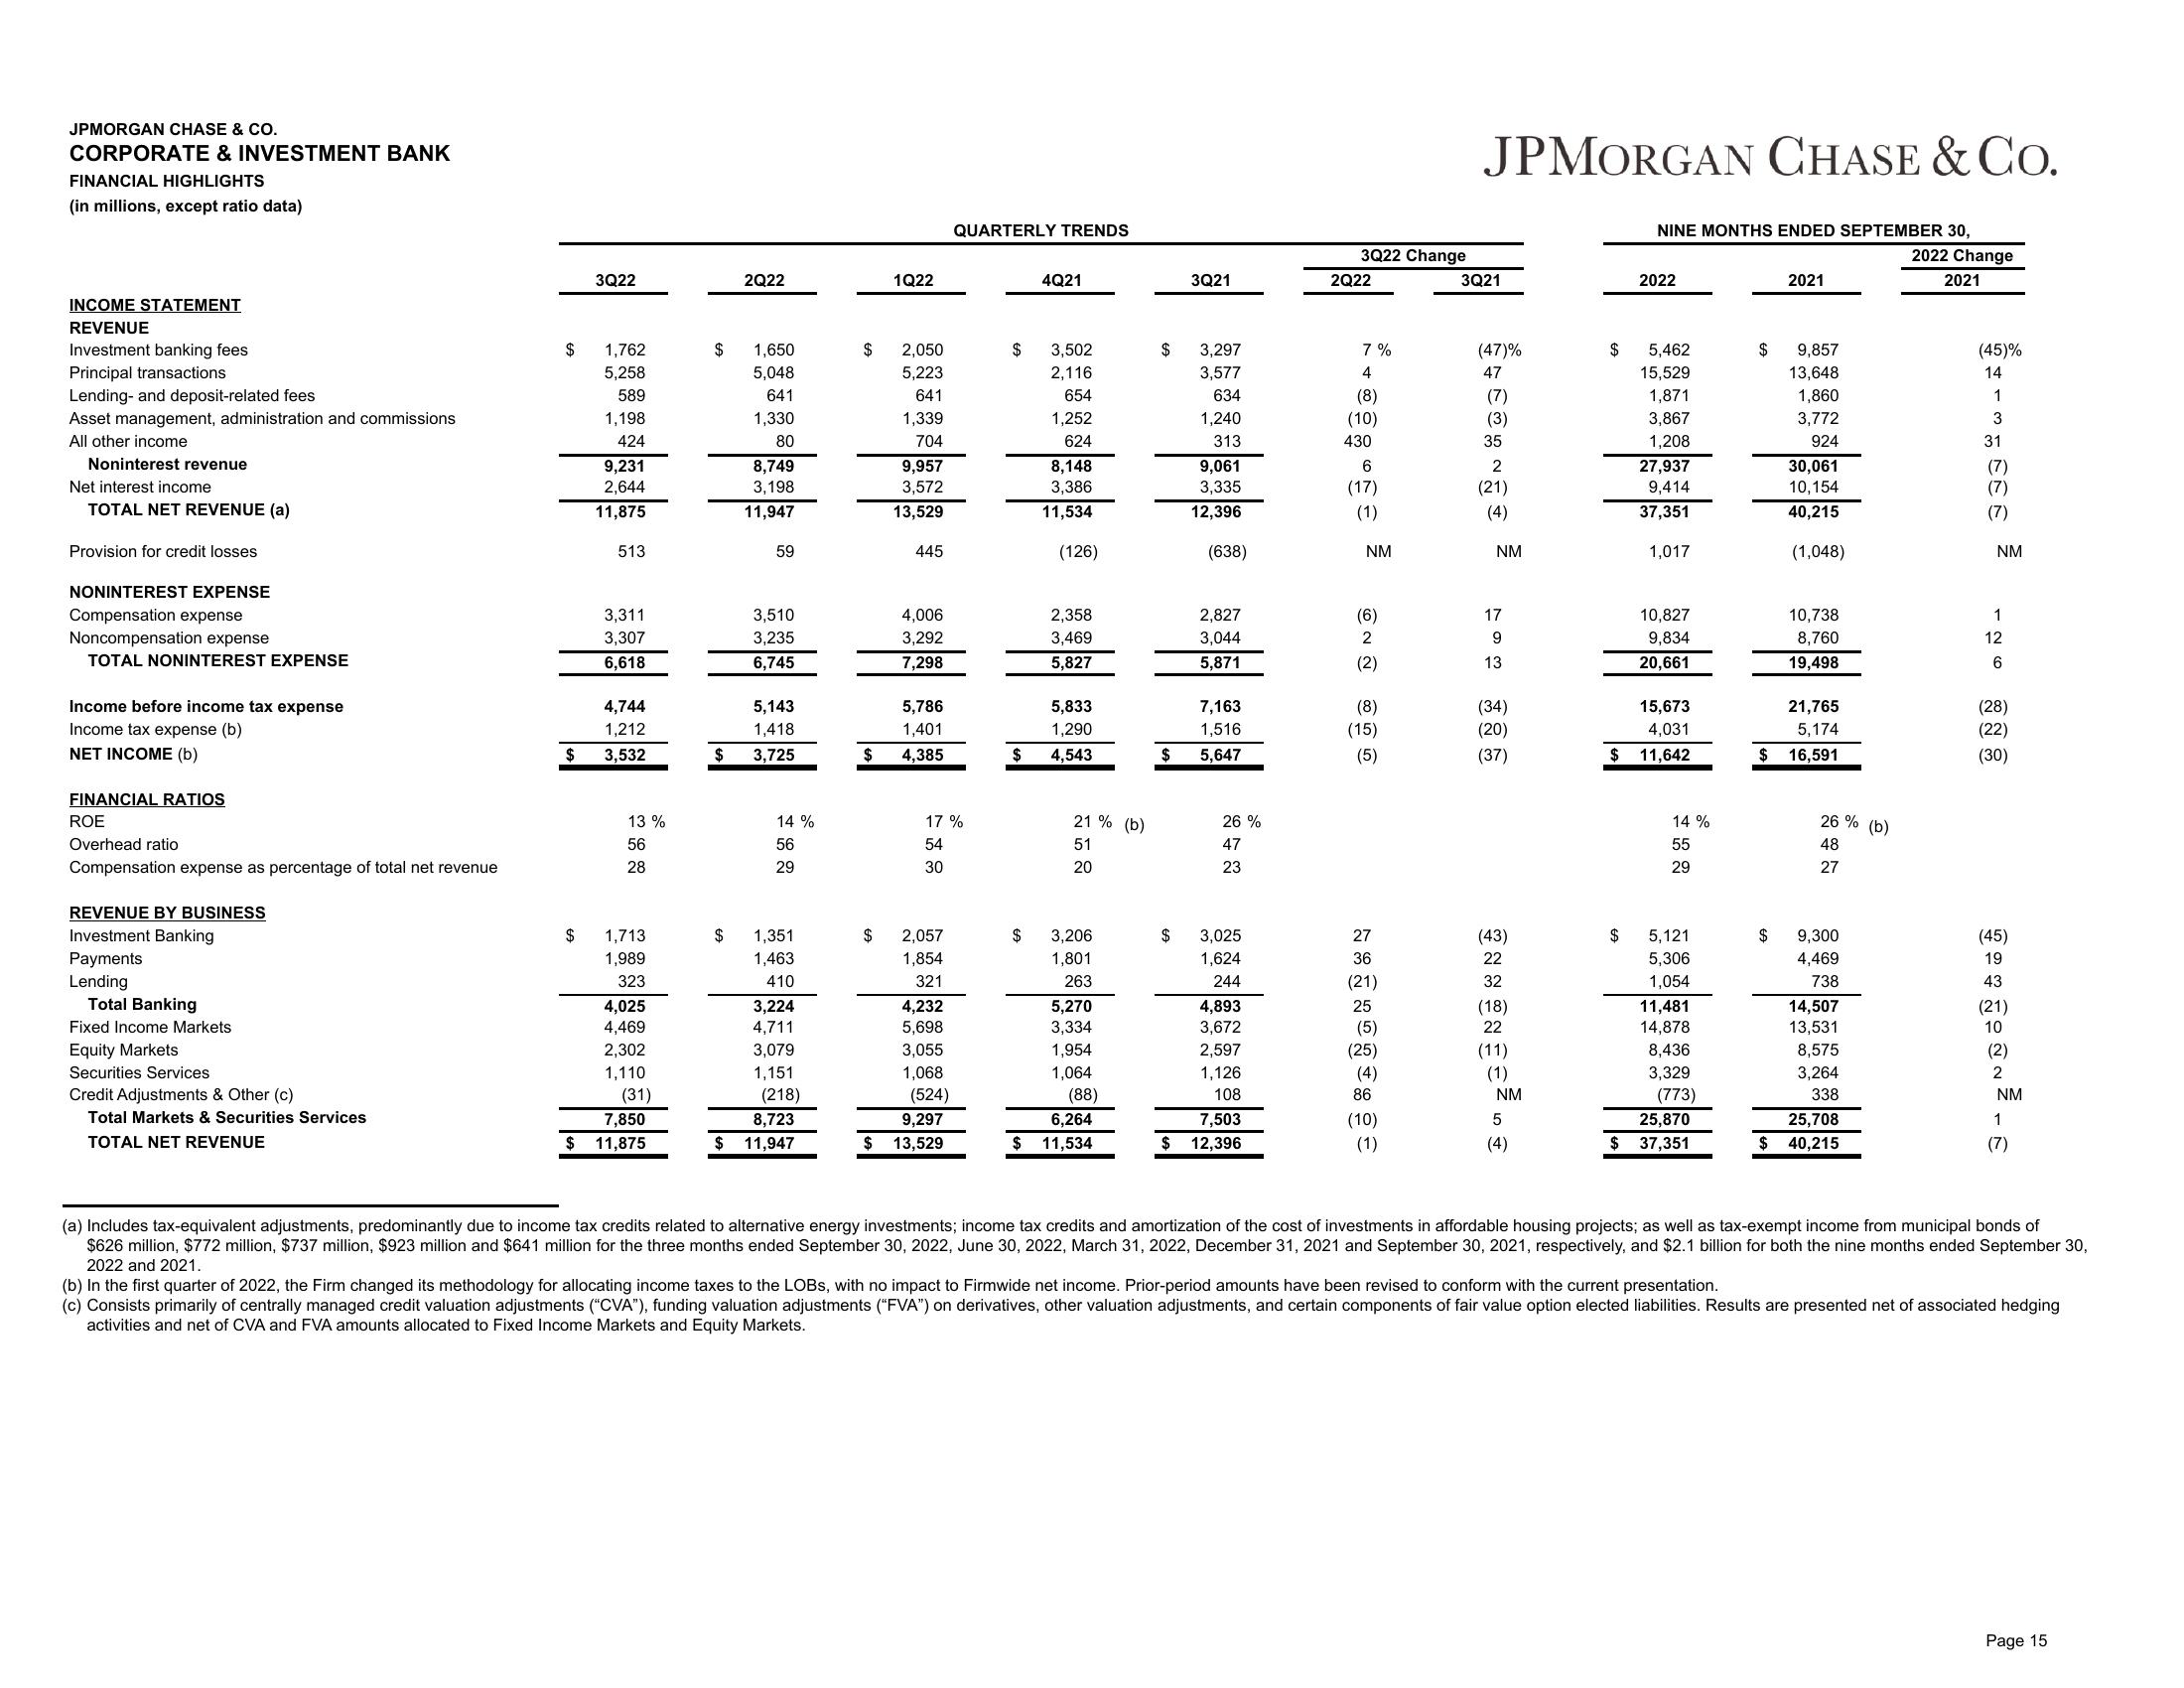
(a) Includes tax-equivalent adjustments, predominantly due to income tax credits related to alternative energy investments; income tax credits and amortization of the cost of investments in affordable housing projects; as well as tax-exempt income from municipal bonds of
$626 million, $772 million, $737 million, $923 million and $641 million for the three months ended September 30, 2022, June 30, 2022, March 31, 2022, December 31, 2021 and September 30, 2021, respectively, and $2.1 billion for both the nine months ended September 30,
2022 and 2021.
(b) In the first quarter of 2022, the Firm changed its methodology for allocating income taxes to the LOBS, with no impact to Firmwide net income. Prior-period amounts have been revised to conform with the current presentation.
(c) Consists primarily of centrally managed credit valuation adjustments ("CVA"), funding valuation adjustments ("FVA") on derivatives, other valuation adjustments, and certain components of fair value option elected liabilities. Results are presented net of associated hedging
activities and net of CVA and FVA amounts allocated to Fixed Income Markets and Equity Markets.
Page 15View entire presentation