Casper Investor Presentation Deck
с
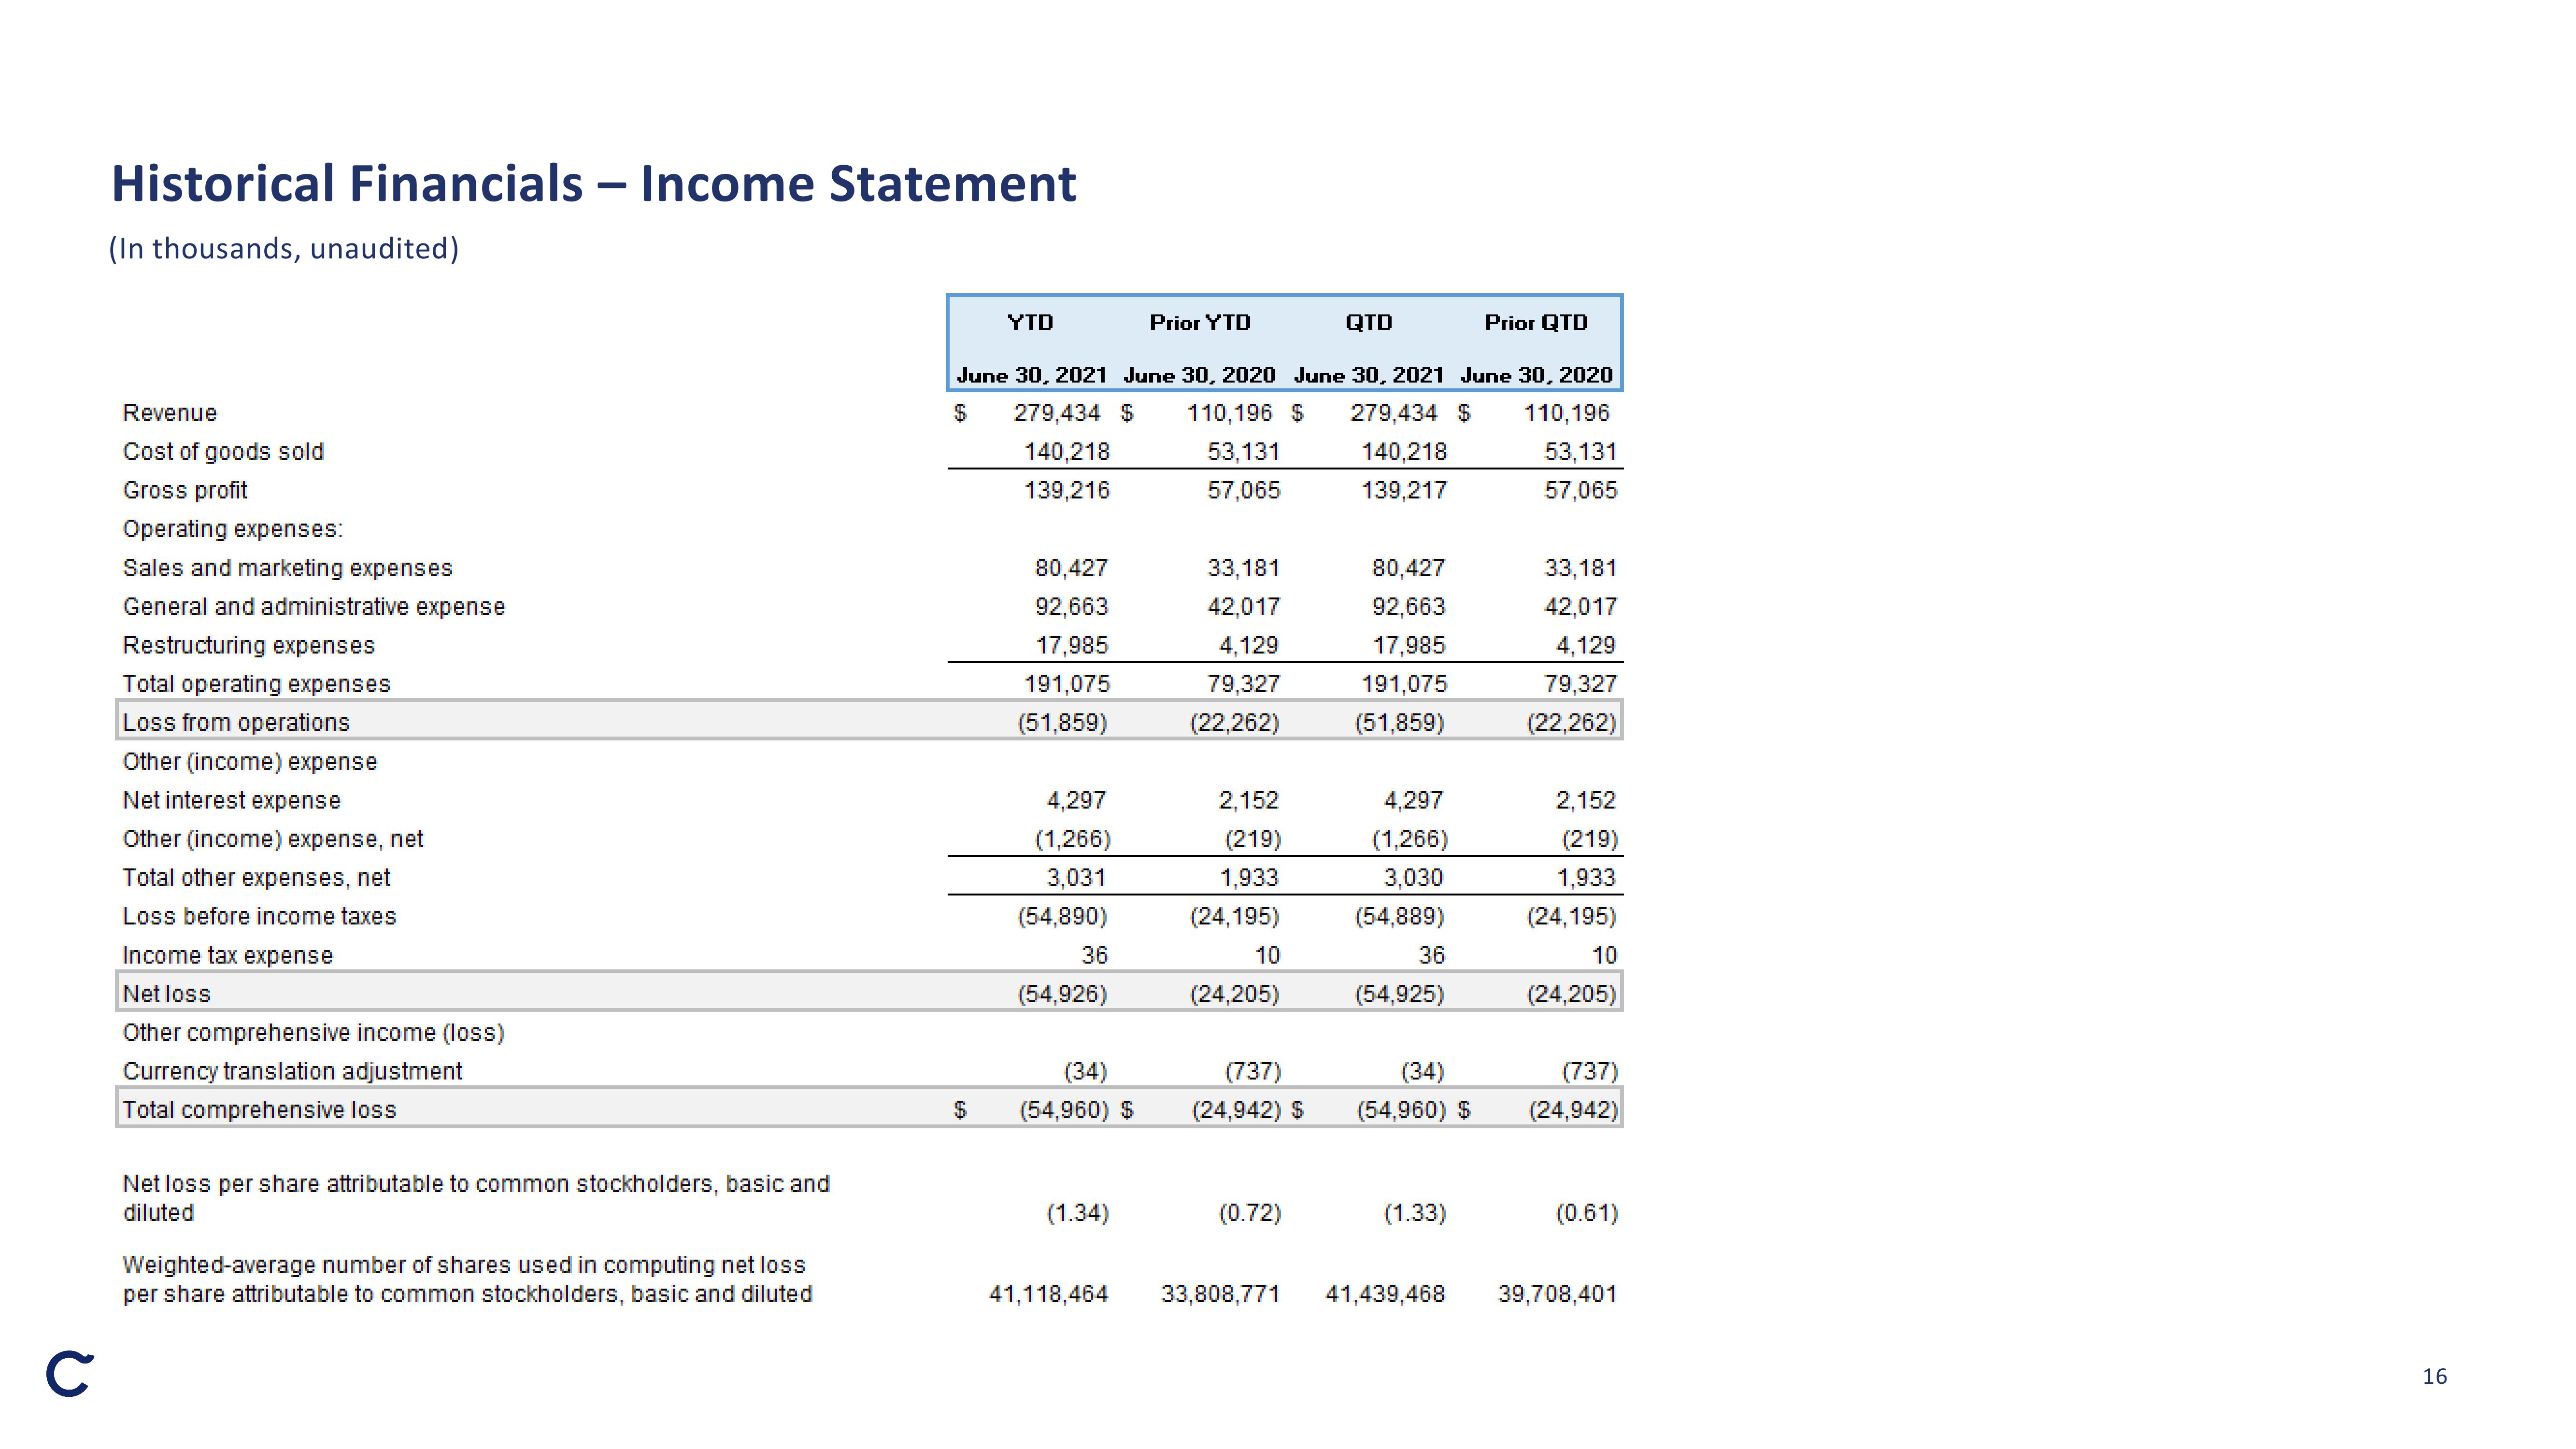
Historical Financials - Income Statement
(In thousands, unaudited)
Revenue
Cost of goods sold
Gross profit
Operating expenses:
Sales and marketing expenses
General and administrative expense
Restructuring expenses
Total operating expenses
Loss from operations
Other (income) expense
Net interest expense
Other (income) expense, net
Total other expenses, net
Loss before income taxes
Income tax expense
Net loss
Other comprehensive income (loss)
Currency translation adjustment
Total comprehensive loss
Net loss per share attributable to common stockholders, basic and
diluted
Weighted-average number of shares used in computing net loss
per share attributable to common stockholders, basic and diluted
YTD
$
June 30, 2021 June 30, 2020
279,434 $ 110,196 $
140,218
53,131
139,216
57,065
80,427
92,663
17,985
191,075
(51,859)
4,297
(1,266)
3,031
(54,890)
36
(54,926)
(34)
(54,960) $
(1.34)
Prior YTD
41,118,464
33,181
42,017
4,129
79,327
(22,262)
2,152
(219)
1,933
(24,195)
10
(24,205)
(737)
(24,942) $
(0.72)
QTD
June 30, 2021 June 30, 2020
279,434 $ 110,196
140,218
53,131
139,217
57,065
80,427
92,663
17,985
191,075
(51,859)
4,297
(1,266)
3,030
(54,889)
36
(54,925)
(34)
(54,960) $
(1.33)
Prior QTD
33,808,771 41,439,468
33,181
42,017
4,129
79,327
(22,262)
2,152
(219)
1,933
(24,195)
10
(24,205)
(737)
(24,942)
(0.61)
39,708,401
16View entire presentation