Aptiv Overview
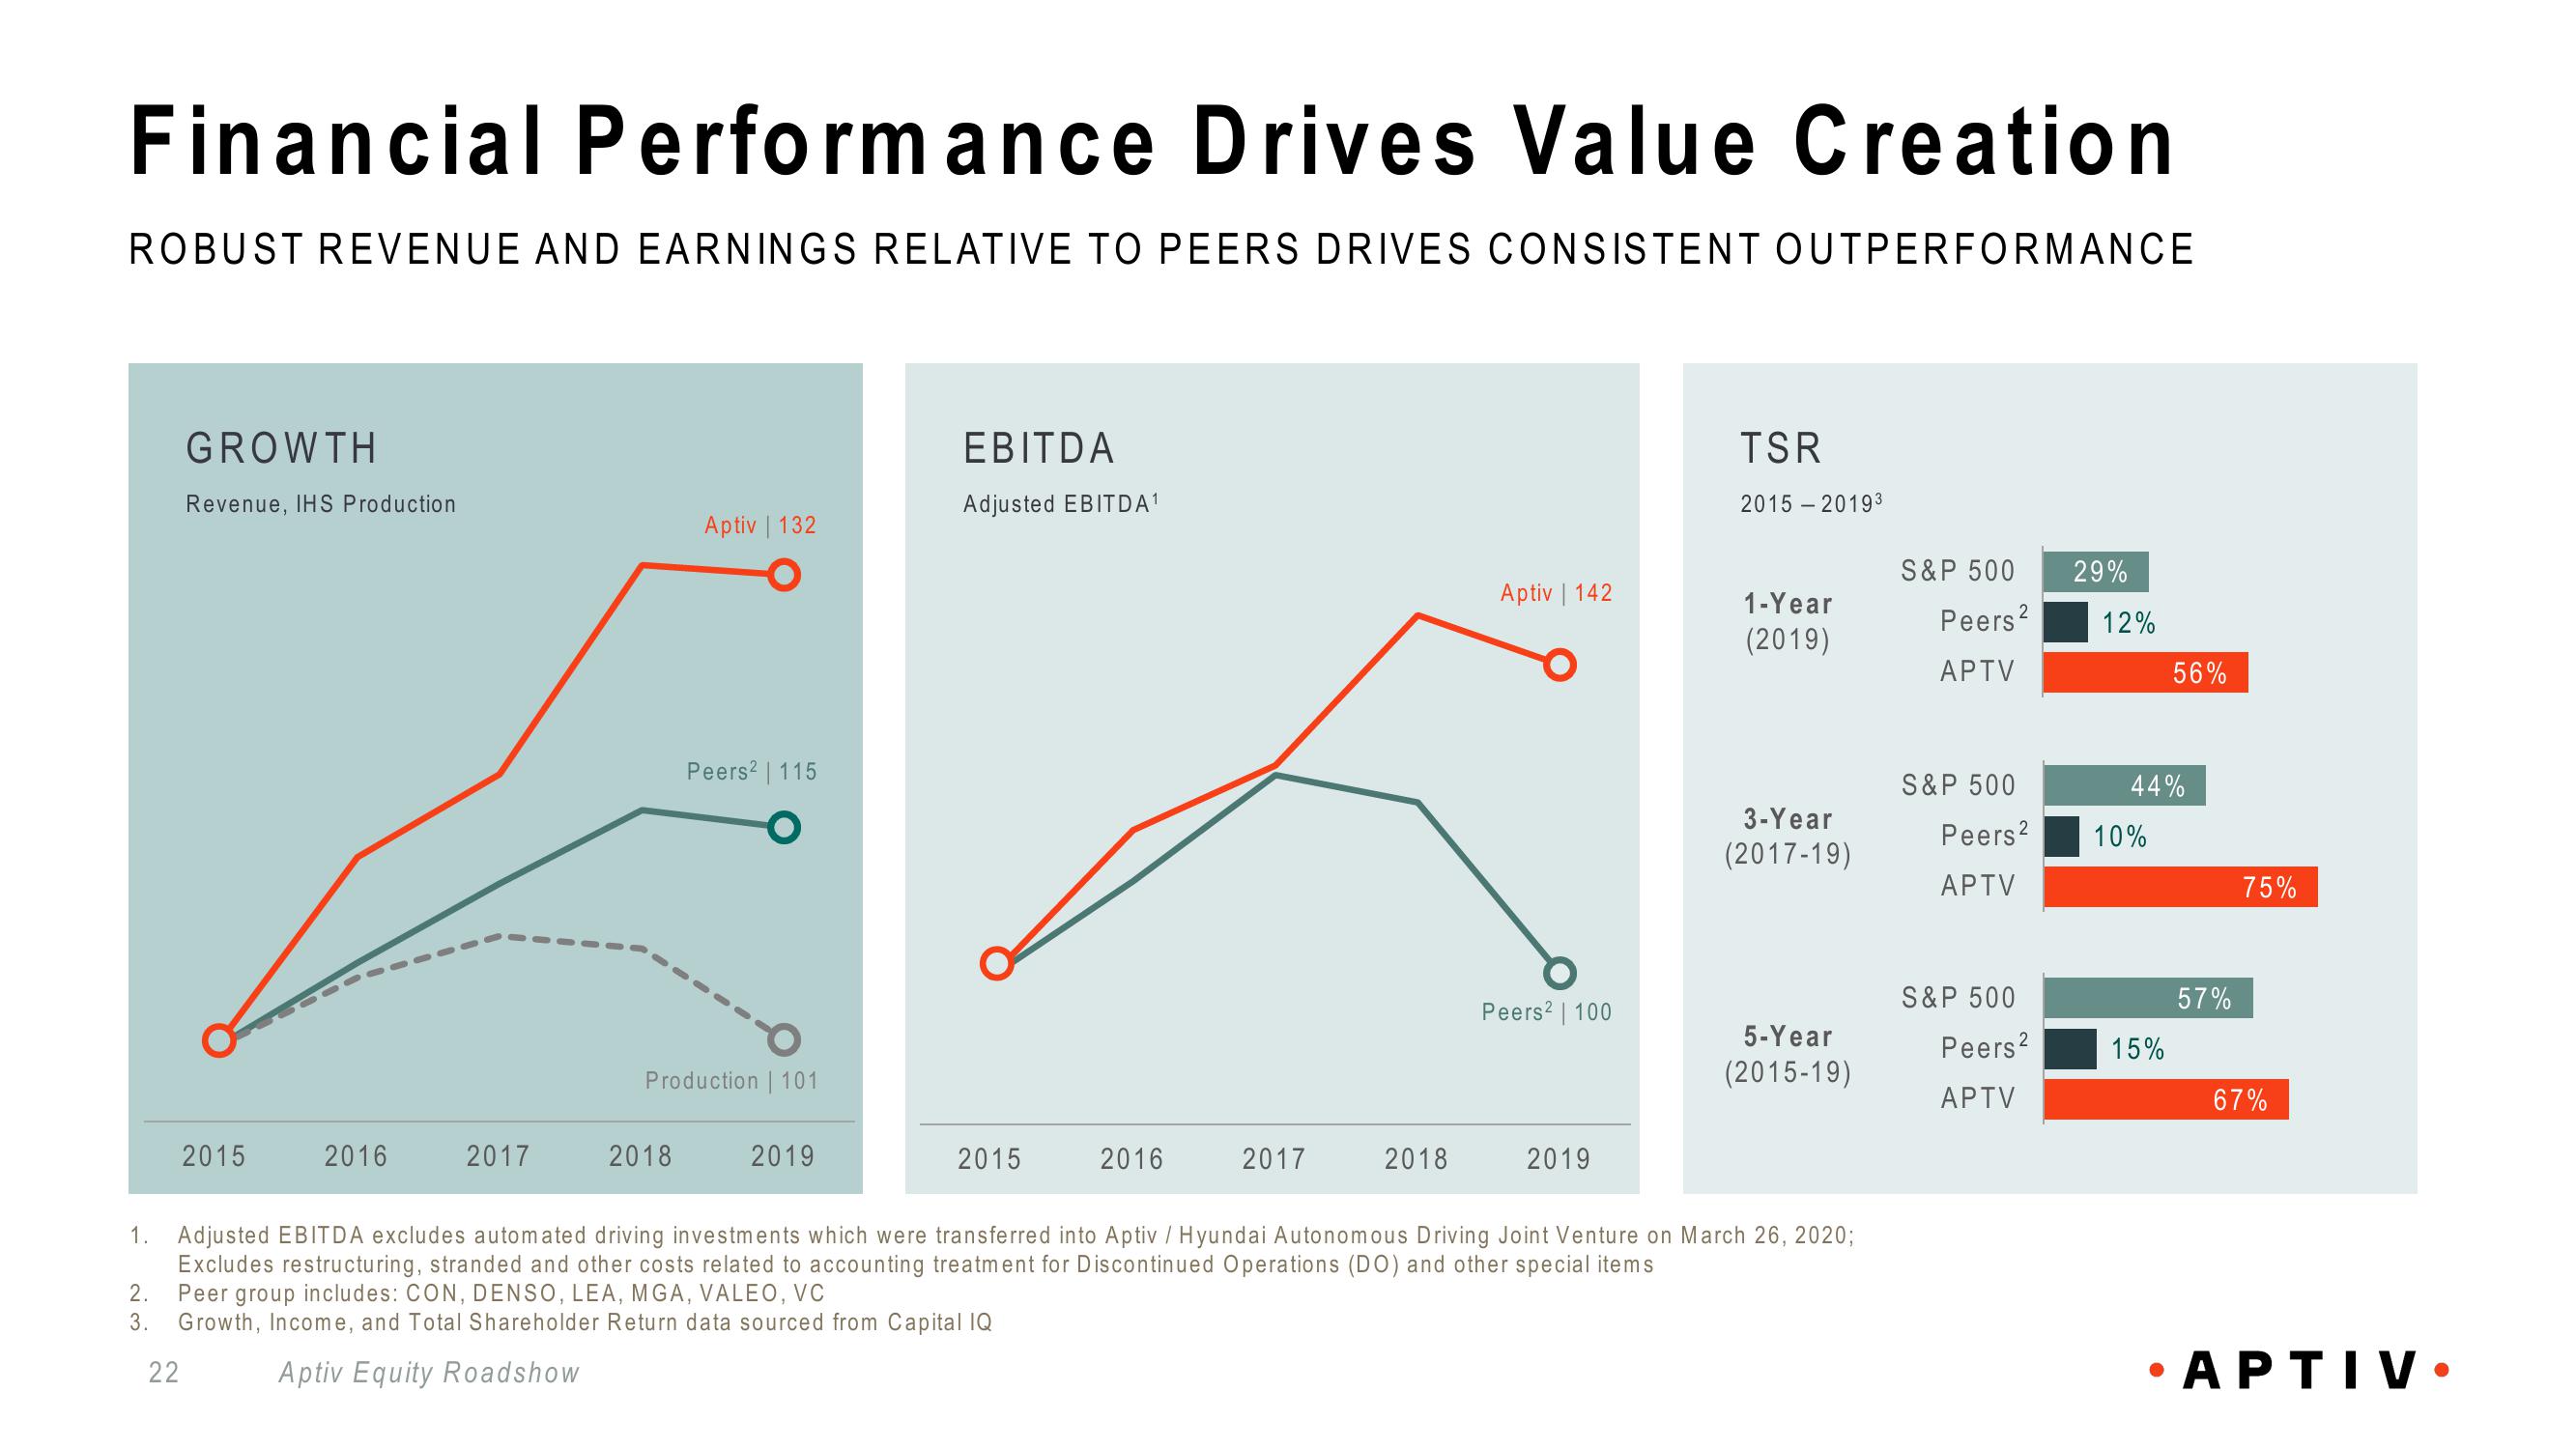
Financial Performance Drives Value Creation
ROBUST REVENUE AND EARNINGS RELATIVE TO PEERS DRIVES CONSISTENT OUTPERFORMANCE
GROWTH
Revenue, IHS Production
2015
2016
2017
Aptiv | 132
2018
Peers² | 115
Production | 101
2019
EBITDA
Adjusted EBITDA¹
2015
2016
2017
2018
Aptiv | 142
Peers² | 100
2019
TSR
2015-20193
1-Year
(2019)
3-Year
(2017-19)
5-Year
(2015-19)
1. Adjusted EBITDA excludes automated driving investments which were transferred into Aptiv / Hyundai Autonomous Driving Joint Venture on March 26, 2020;
Excludes restructuring, stranded and other costs related to accounting treatment for Discontinued Operations (DO) and other special items
2. Peer group includes: CON, DENSO, LEA, MGA, VALEO, VC
3. Growth, Income, and Total Shareholder Return data sourced from Capital IQ
22
Aptiv Equity Roadshow
S&P 500
Peers²
APTV
S&P 500
S&P 500
29%
Peers²
APTV
12%
Peers² 10%
APTV
44%
56%
15%
57%
75%
67%
•APTIV.View entire presentation