Ciena Corporation Earnings Presentation
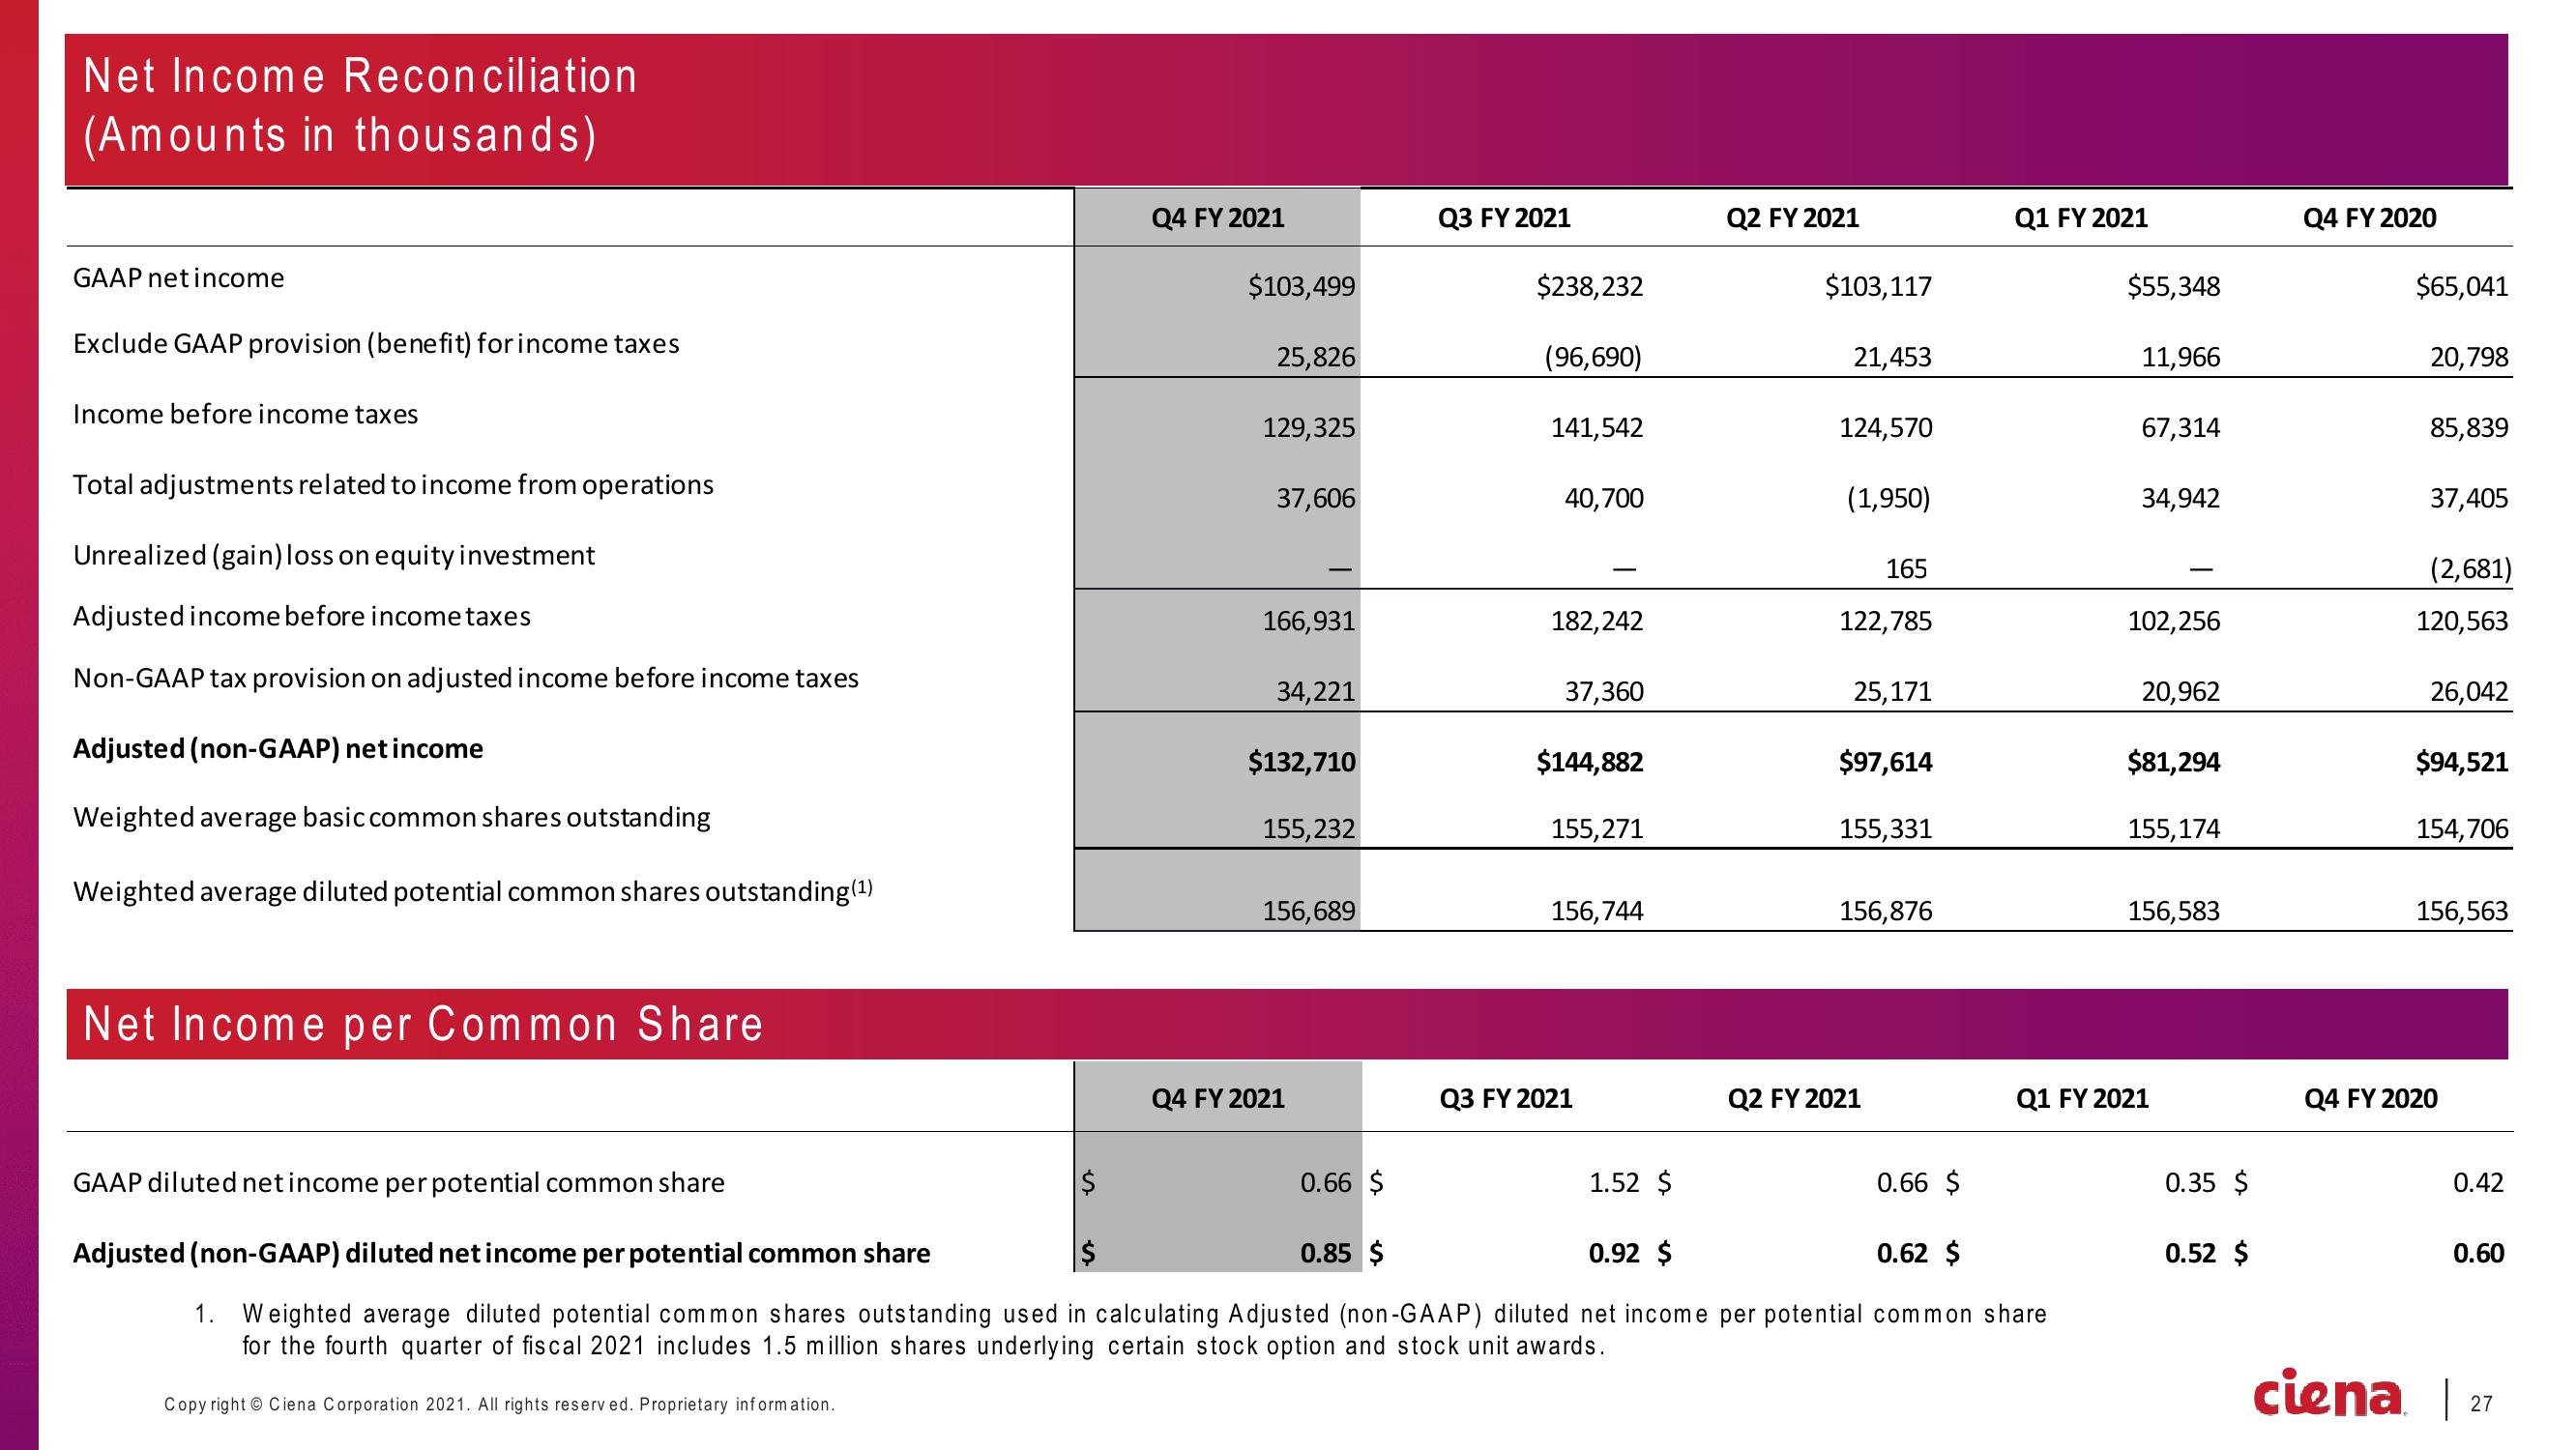
Net Income Reconciliation
(Amounts in thousands)
GAAP net income
Exclude GAAP provision (benefit) for income taxes
Income before income taxes
Total adjustments related to income from operations
Unrealized (gain) loss on equity investment
Adjusted income before income taxes
Non-GAAP tax provision on adjusted income before income taxes
Adjusted (non-GAAP) net income
Weighted average basic common shares outstanding
Weighted average diluted potential common shares outstanding (¹)
Net Income per Common Share
Q4 FY 2021
Copyright Ciena Corporation 2021. All rights reserved. Proprietary information.
$103,499
25,826
129,325
37,606
166,931
34,221
$132,710
155,232
156,689
Q4 FY 2021
0.66 $
Q3 FY 2021
0.85 $
$238,232
(96,690)
141,542
40,700
182,242
37,360
$144,882
155,271
156,744
Q3 FY 2021
1.52 $
Q2 FY 2021
$103,117
21,453
124,570
(1,950)
165
122,785
25,171
$97,614
155,331
156,876
Q2 FY 2021
Q1 FY 2021
GAAP diluted net income per potential common share
0.66 $
0.92 $
0.62 $
Adjusted (non-GAAP) diluted net income per potential common share
1. Weighted average diluted potential common shares outstanding used in calculating Adjusted (non-GAAP) diluted net income per potential common share
for the fourth quarter of fiscal 2021 includes 1.5 million shares underlying certain stock option and stock unit awards.
$55,348
11,966
67,314
34,942
102,256
20,962
$81,294
155,174
156,583
Q1 FY 2021
0.35 $
0.52 $
Q4 FY 2020
$65,041
20,798
85,839
37,405
(2,681)
120,563
26,042
$94,521
154,706
156,563
Q4 FY 2020
0.42
0.60
ciena | 27View entire presentation