Main Street Capital Investor Day Presentation Deck
MAIN's Strategy Consistently Produces Differentiated
Returns
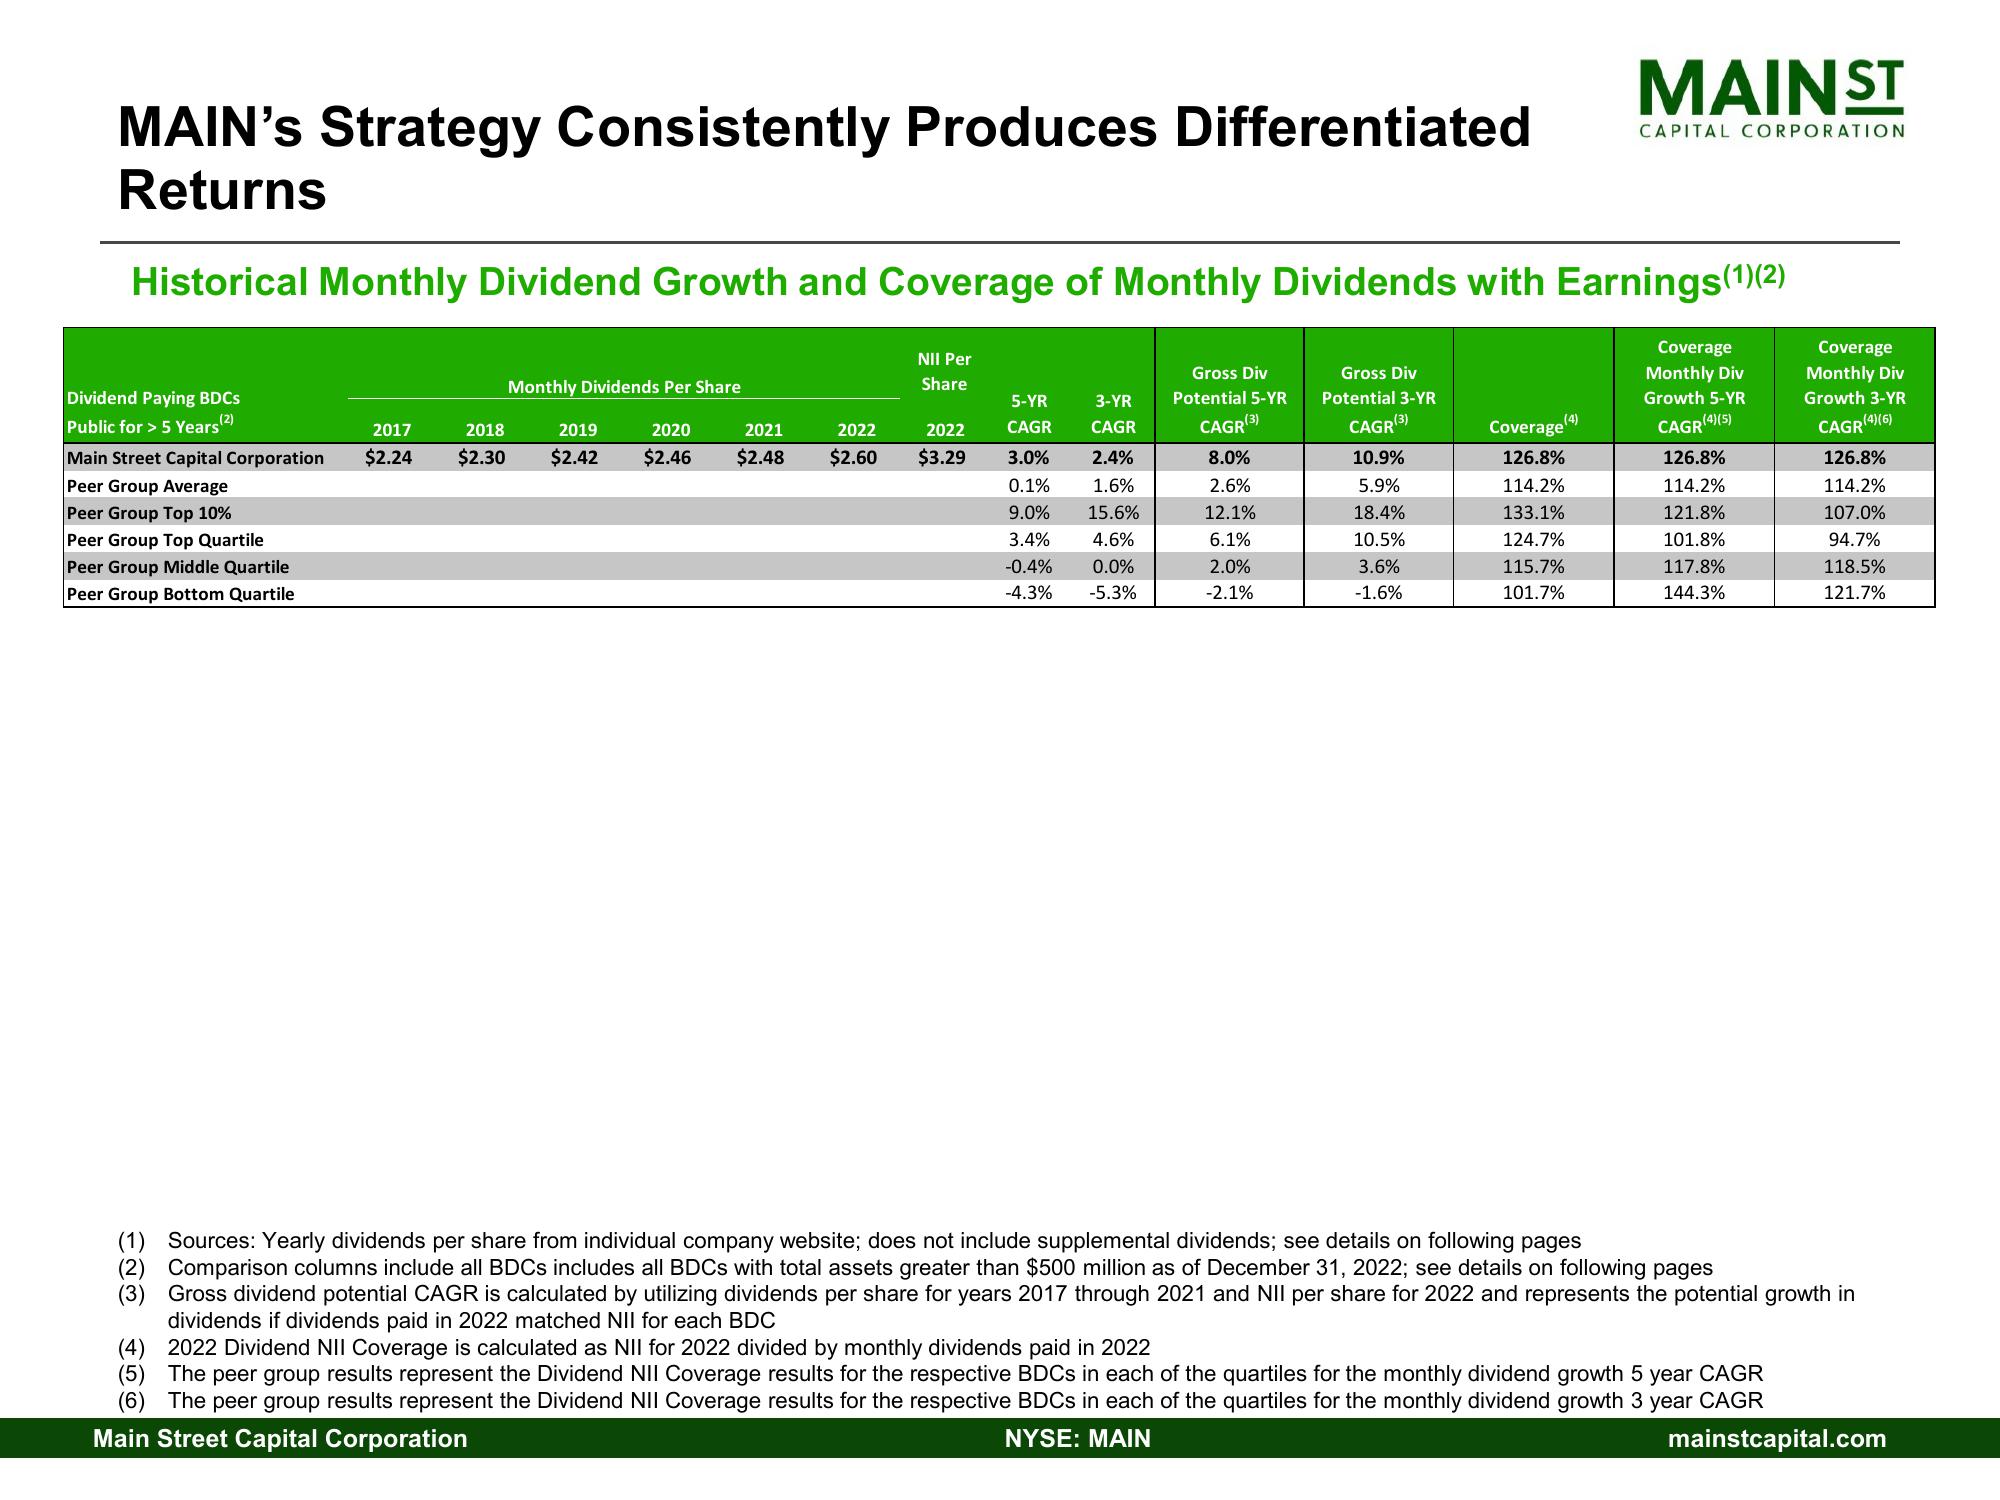
Historical Monthly Dividend Growth and Coverage of Monthly Dividends with Earnings (1)(2)
Dividend Paying BDCs
Public for > 5 Years (2)
Main Street Capital Corporation
Peer Group Average
Peer Group Top 10%
Peer Group Top Quartile
Peer Group Middle Quartile
Peer Group Bottom Quartile
NE
2017
$2.24
(3)
Monthly Dividends Per Share
2018
2019
2020
$2.30 $2.42 $2.46
2021
$2.48
2022
$2.60
NII Per
Share
5-YR 3-YR
CAGR CAGR
2022
$3.29 3.0%
2.4%
1.6%
0.1%
9.0% 15.6%
3.4%
4.6%
-0.4%
0.0%
-5.3%
-4.3%
Gross Div
Potential 5-YR
CAGR (3)
8.0%
2.6%
12.1%
6.1%
2.0%
-2.1%
Gross Div
Potential 3-YR
CAGR (3)
10.9%
5.9%
18.4%
10.5%
3.6%
-1.6%
(4)
MAINST
Coverage
126.8%
114.2%
133.1%
124.7%
115.7%
101.7%
CAPITAL CORPORATION
Coverage
Monthly Div
Growth 5-YR
(4)(5)
CAGR
126.8%
114.2%
121.8%
101.8%
117.8%
144.3%
(1) Sources: Yearly dividends per share from individual company website; does not include supplemental dividends; see details on following pages
Comparison columns include all BDCs includes all BDCs with total assets greater than $500 million as of December 31, 2022; see details on following pages
Gross dividend potential CAGR is calculated by utilizing dividends per share for years 2017 through 2021 and NII per share for 2022 and represents the potential growth in
dividends if dividends paid in 2022 matched NII for each BDC
(4) 2022 Dividend NII Coverage calculated as NII for 2022 divided by monthly dividends paid in 2022
(5) The peer group results represent the Dividend NII Coverage results for the respective BDCs in each of the quartiles for the monthly dividend growth 5 year CAGR
(6) The peer group results represent the Dividend NII Coverage results for the respective BDCs in each of the quartiles for the monthly dividend growth 3 year CAGR
Main Street Capital Corporation
NYSE: MAIN
mainstcapital.com
Coverage
Monthly Div
Growth 3-YR
CAGR (4)(6)
126.8%
114.2%
107.0%
94.7%
118.5%
121.7%View entire presentation