Third Quarter 2022 Earnings Conference Call
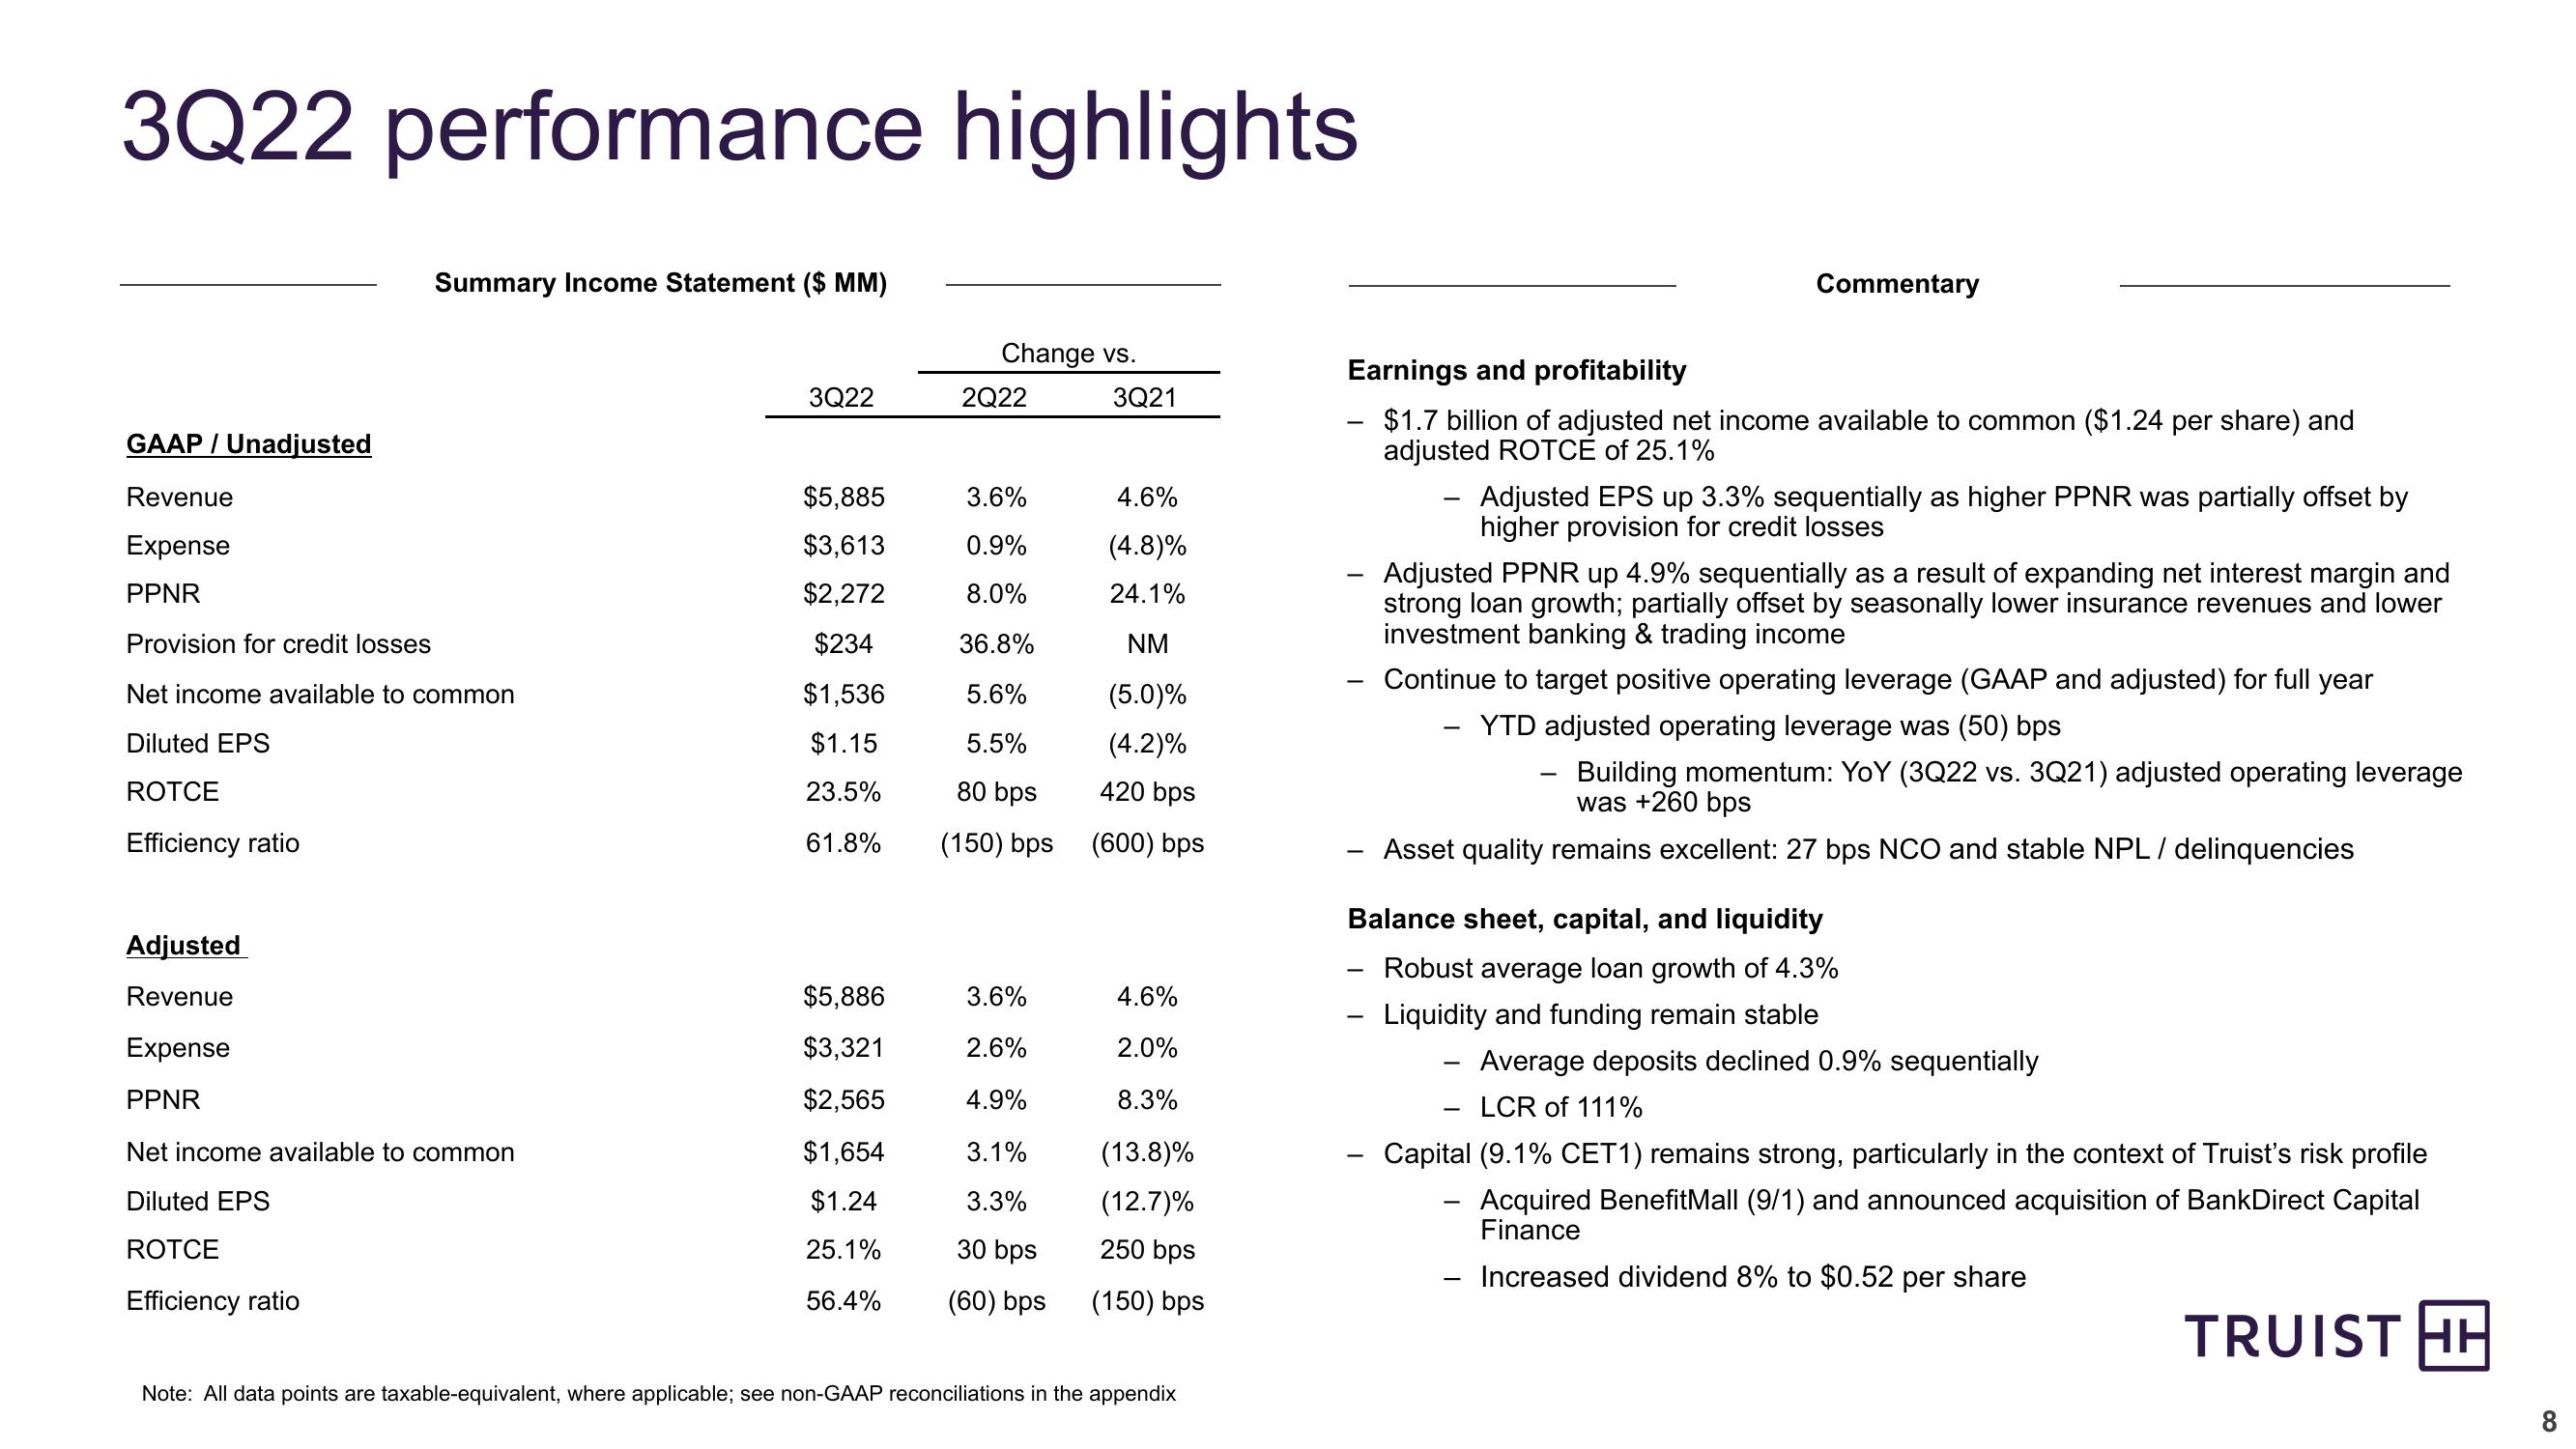
3Q22 performance highlights
GAAP / Unadjusted
Summary Income Statement ($ MM)
Change vs.
3Q22
2Q22
3Q21
Revenue
Expense
$5,885
3.6%
4.6%
$3,613
0.9%
(4.8)%
PPNR
$2,272
8.0%
Provision for credit losses
$234
36.8%
Net income available to common
$1,536
5.6%
24.1%
NM
(5.0)%
Diluted EPS
$1.15
5.5%
(4.2)%
ROTCE
23.5%
80 bps
420 bps
Efficiency ratio
61.8%
(150) bps
(600) bps
Adjusted
Revenue
$5,886
3.6%
4.6%
Expense
$3,321
2.6%
2.0%
PPNR
$2,565
4.9%
8.3%
Net income available to common
$1,654
3.1%
(13.8)%
Diluted EPS
$1.24
3.3%
ROTCE
25.1%
30 bps
(12.7)%
250 bps
Efficiency ratio
56.4%
(60) bps
(150) bps
Note: All data points are taxable-equivalent, where applicable; see non-GAAP reconciliations in the appendix
Earnings and profitability
Commentary
-
$1.7 billion of adjusted net income available to common ($1.24 per share) and
adjusted ROTCE of 25.1%
-
Adjusted EPS up 3.3% sequentially as higher PPNR was partially offset by
higher provision for credit losses
Adjusted PPNR up 4.9% sequentially as a result of expanding net interest margin and
strong loan growth; partially offset by seasonally lower insurance revenues and lower
investment banking & trading income
Continue to target positive operating leverage (GAAP and adjusted) for full year
-
YTD adjusted operating leverage was (50) bps
Building momentum: YoY (3Q22 vs. 3Q21) adjusted operating leverage
was +260 bps
Asset quality remains excellent: 27 bps NCO and stable NPL / delinquencies
Balance sheet, capital, and liquidity
-
Robust average loan growth of 4.3%
Liquidity and funding remain stable
-
- Average deposits declined 0.9% sequentially
-
LCR of 111%
Capital (9.1% CET1) remains strong, particularly in the context of Truist's risk profile
-
Acquired BenefitMall (9/1) and announced acquisition of BankDirect Capital
Finance
-
Increased dividend 8% to $0.52 per share
TRUIST HH
8View entire presentation