Grove SPAC Presentation Deck
NET REVENUE ($MM)
YOY
GROWTH:
Note:
1.
105
2018A
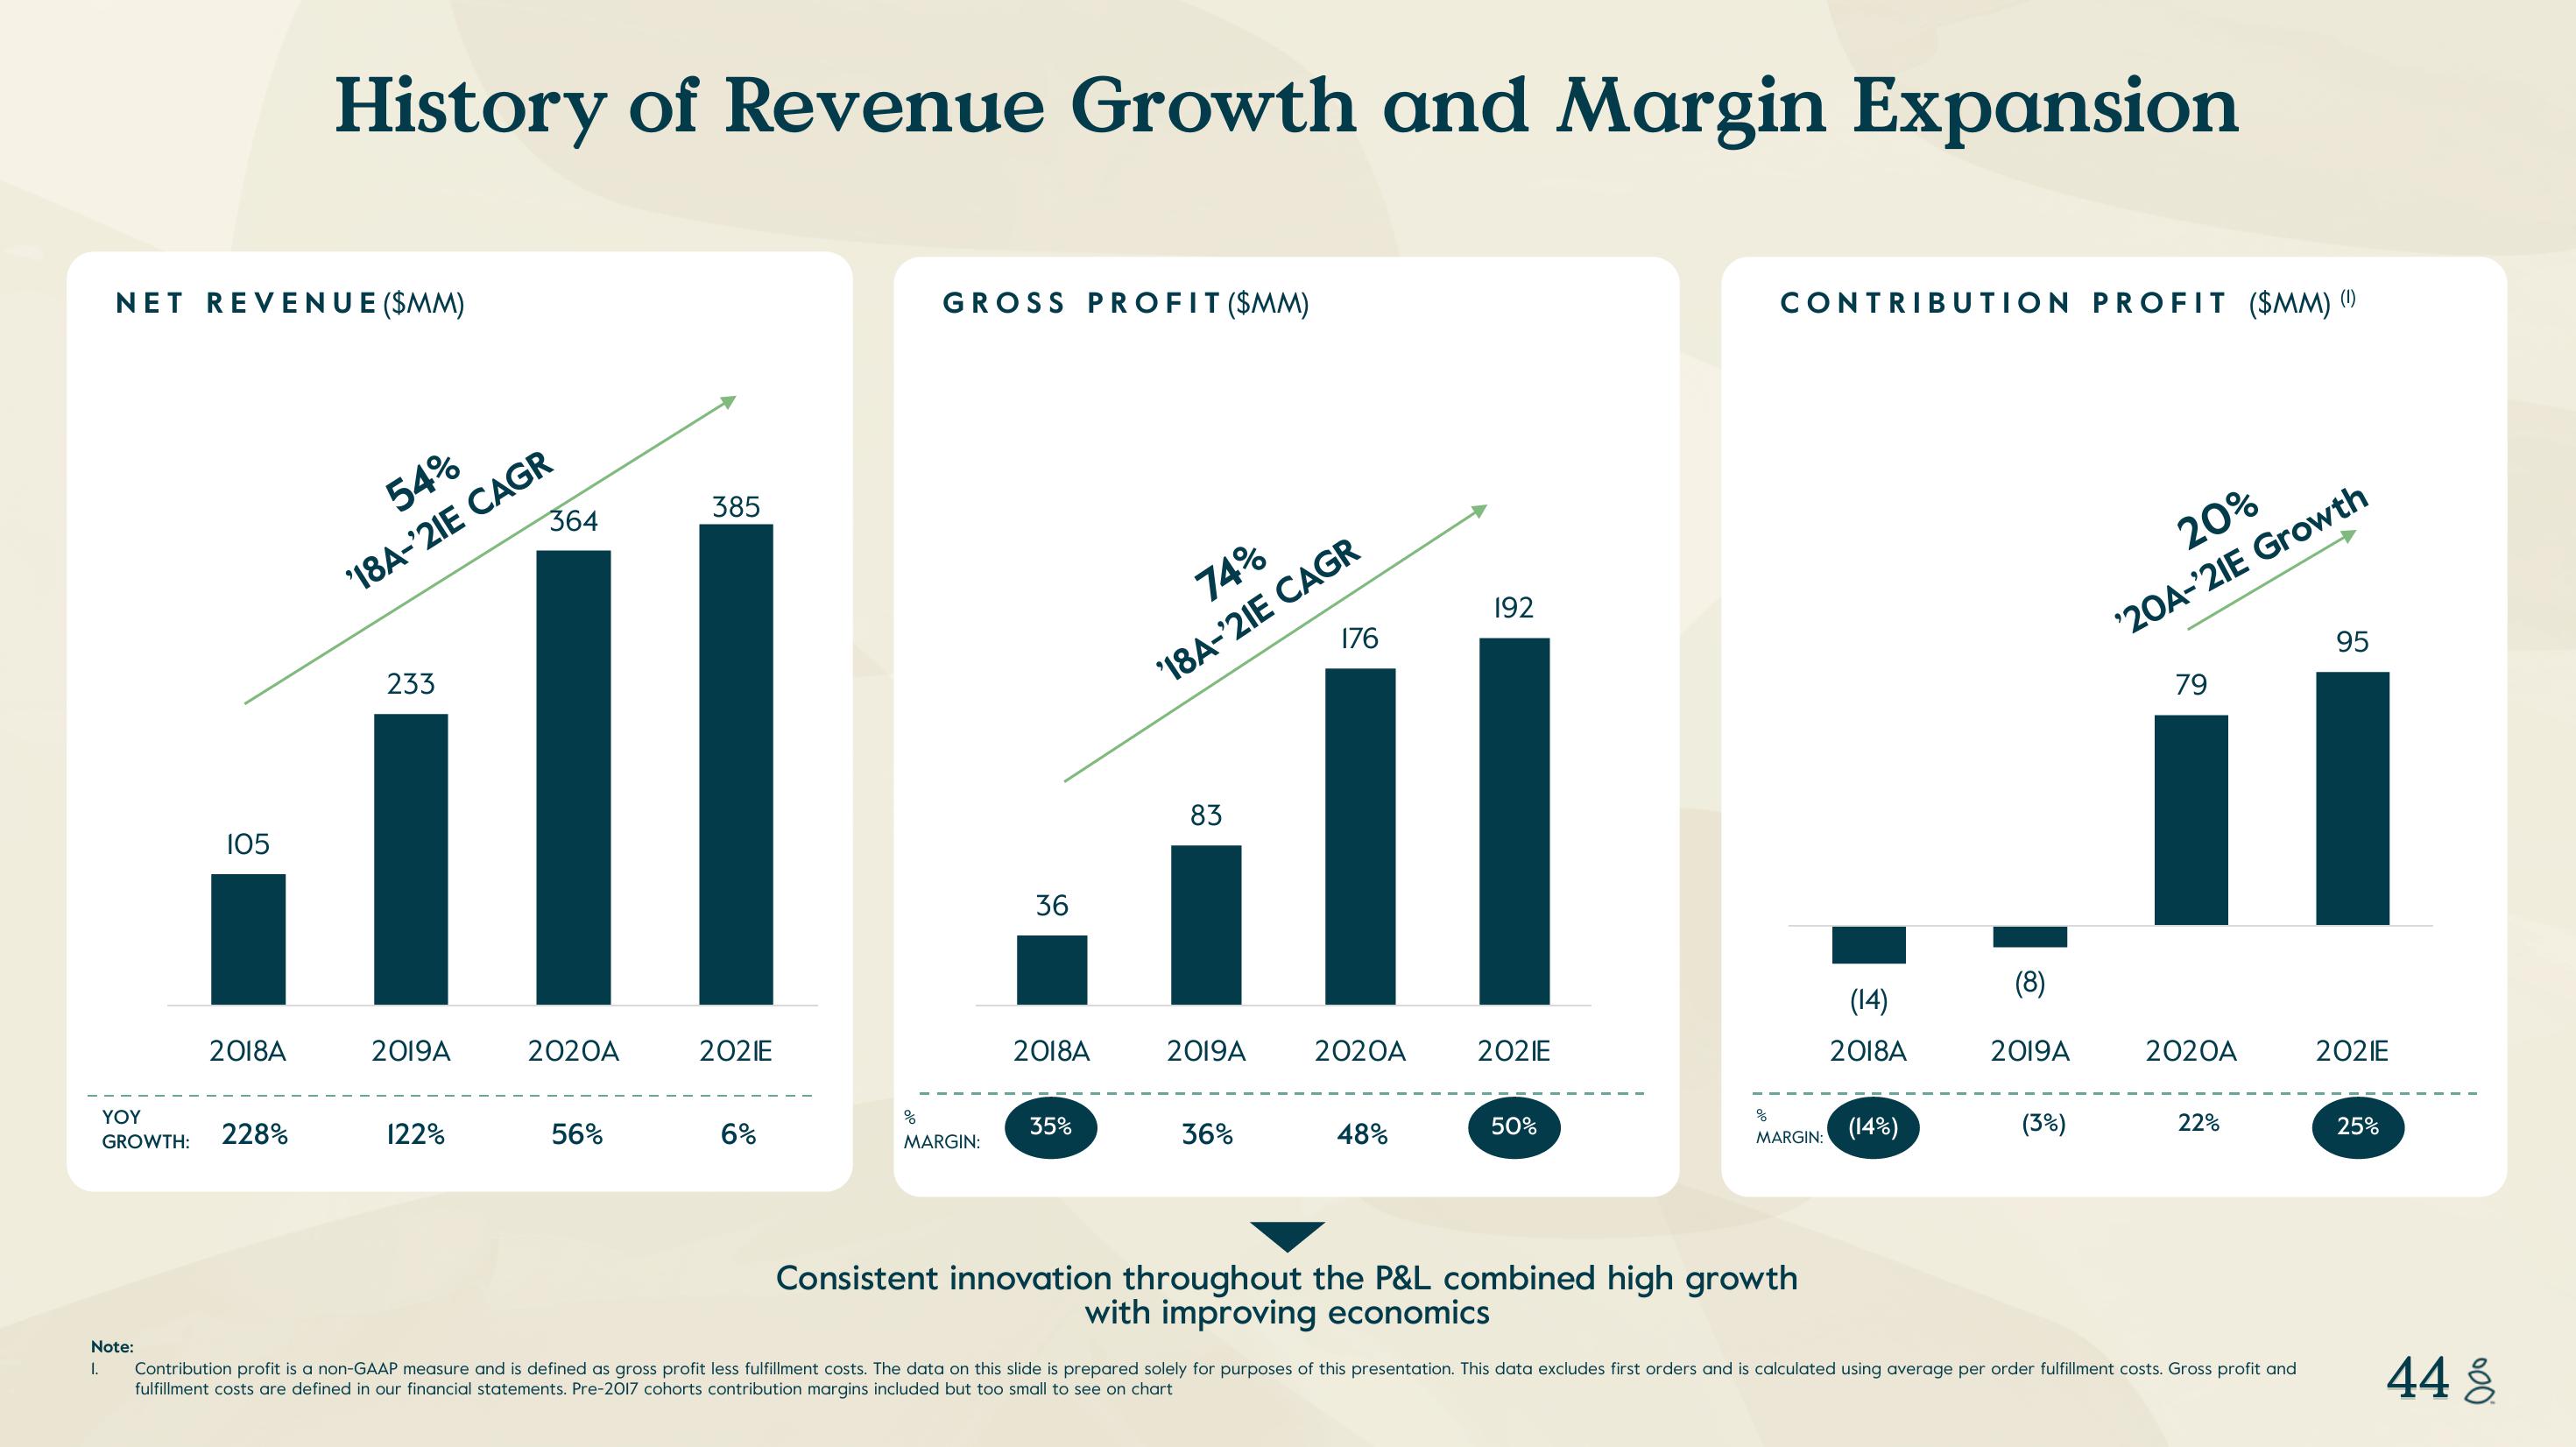
History of Revenue Growth and Margin Expansion
228%
54%
'18A-'21E CAGR
233
2019A
122%
364
2020A
56%
385
2021E
6%
%
GROSS PROFIT ($MM)
MARGIN:
36
2018A
35%
74%
'18A-'21E CAGR
83
2019A
36%
176
2020A
48%
192
2021E
50%
%
CONTRIBUTION PROFIT ($MM)
MARGIN:
Consistent innovation throughout the P&L combined high growth
with improving economics
(14)
2018A
(14%)
(8)
2019A
(3%)
20%
'20A-'21E Growth
79
2020A
22%
Contribution profit is a non-GAAP measure and is defined as gross profit less fulfillment costs. The data on this slide is prepared solely for purposes of this presentation. This data excludes first orders and is calculated using average per order fulfillment costs. Gross profit and
fulfillment costs are defined in our financial statements. Pre-2017 cohorts contribution margins included but too small to see on chart
95
2021E
25%
44 %View entire presentation