Phreesia Investor Presentation Deck
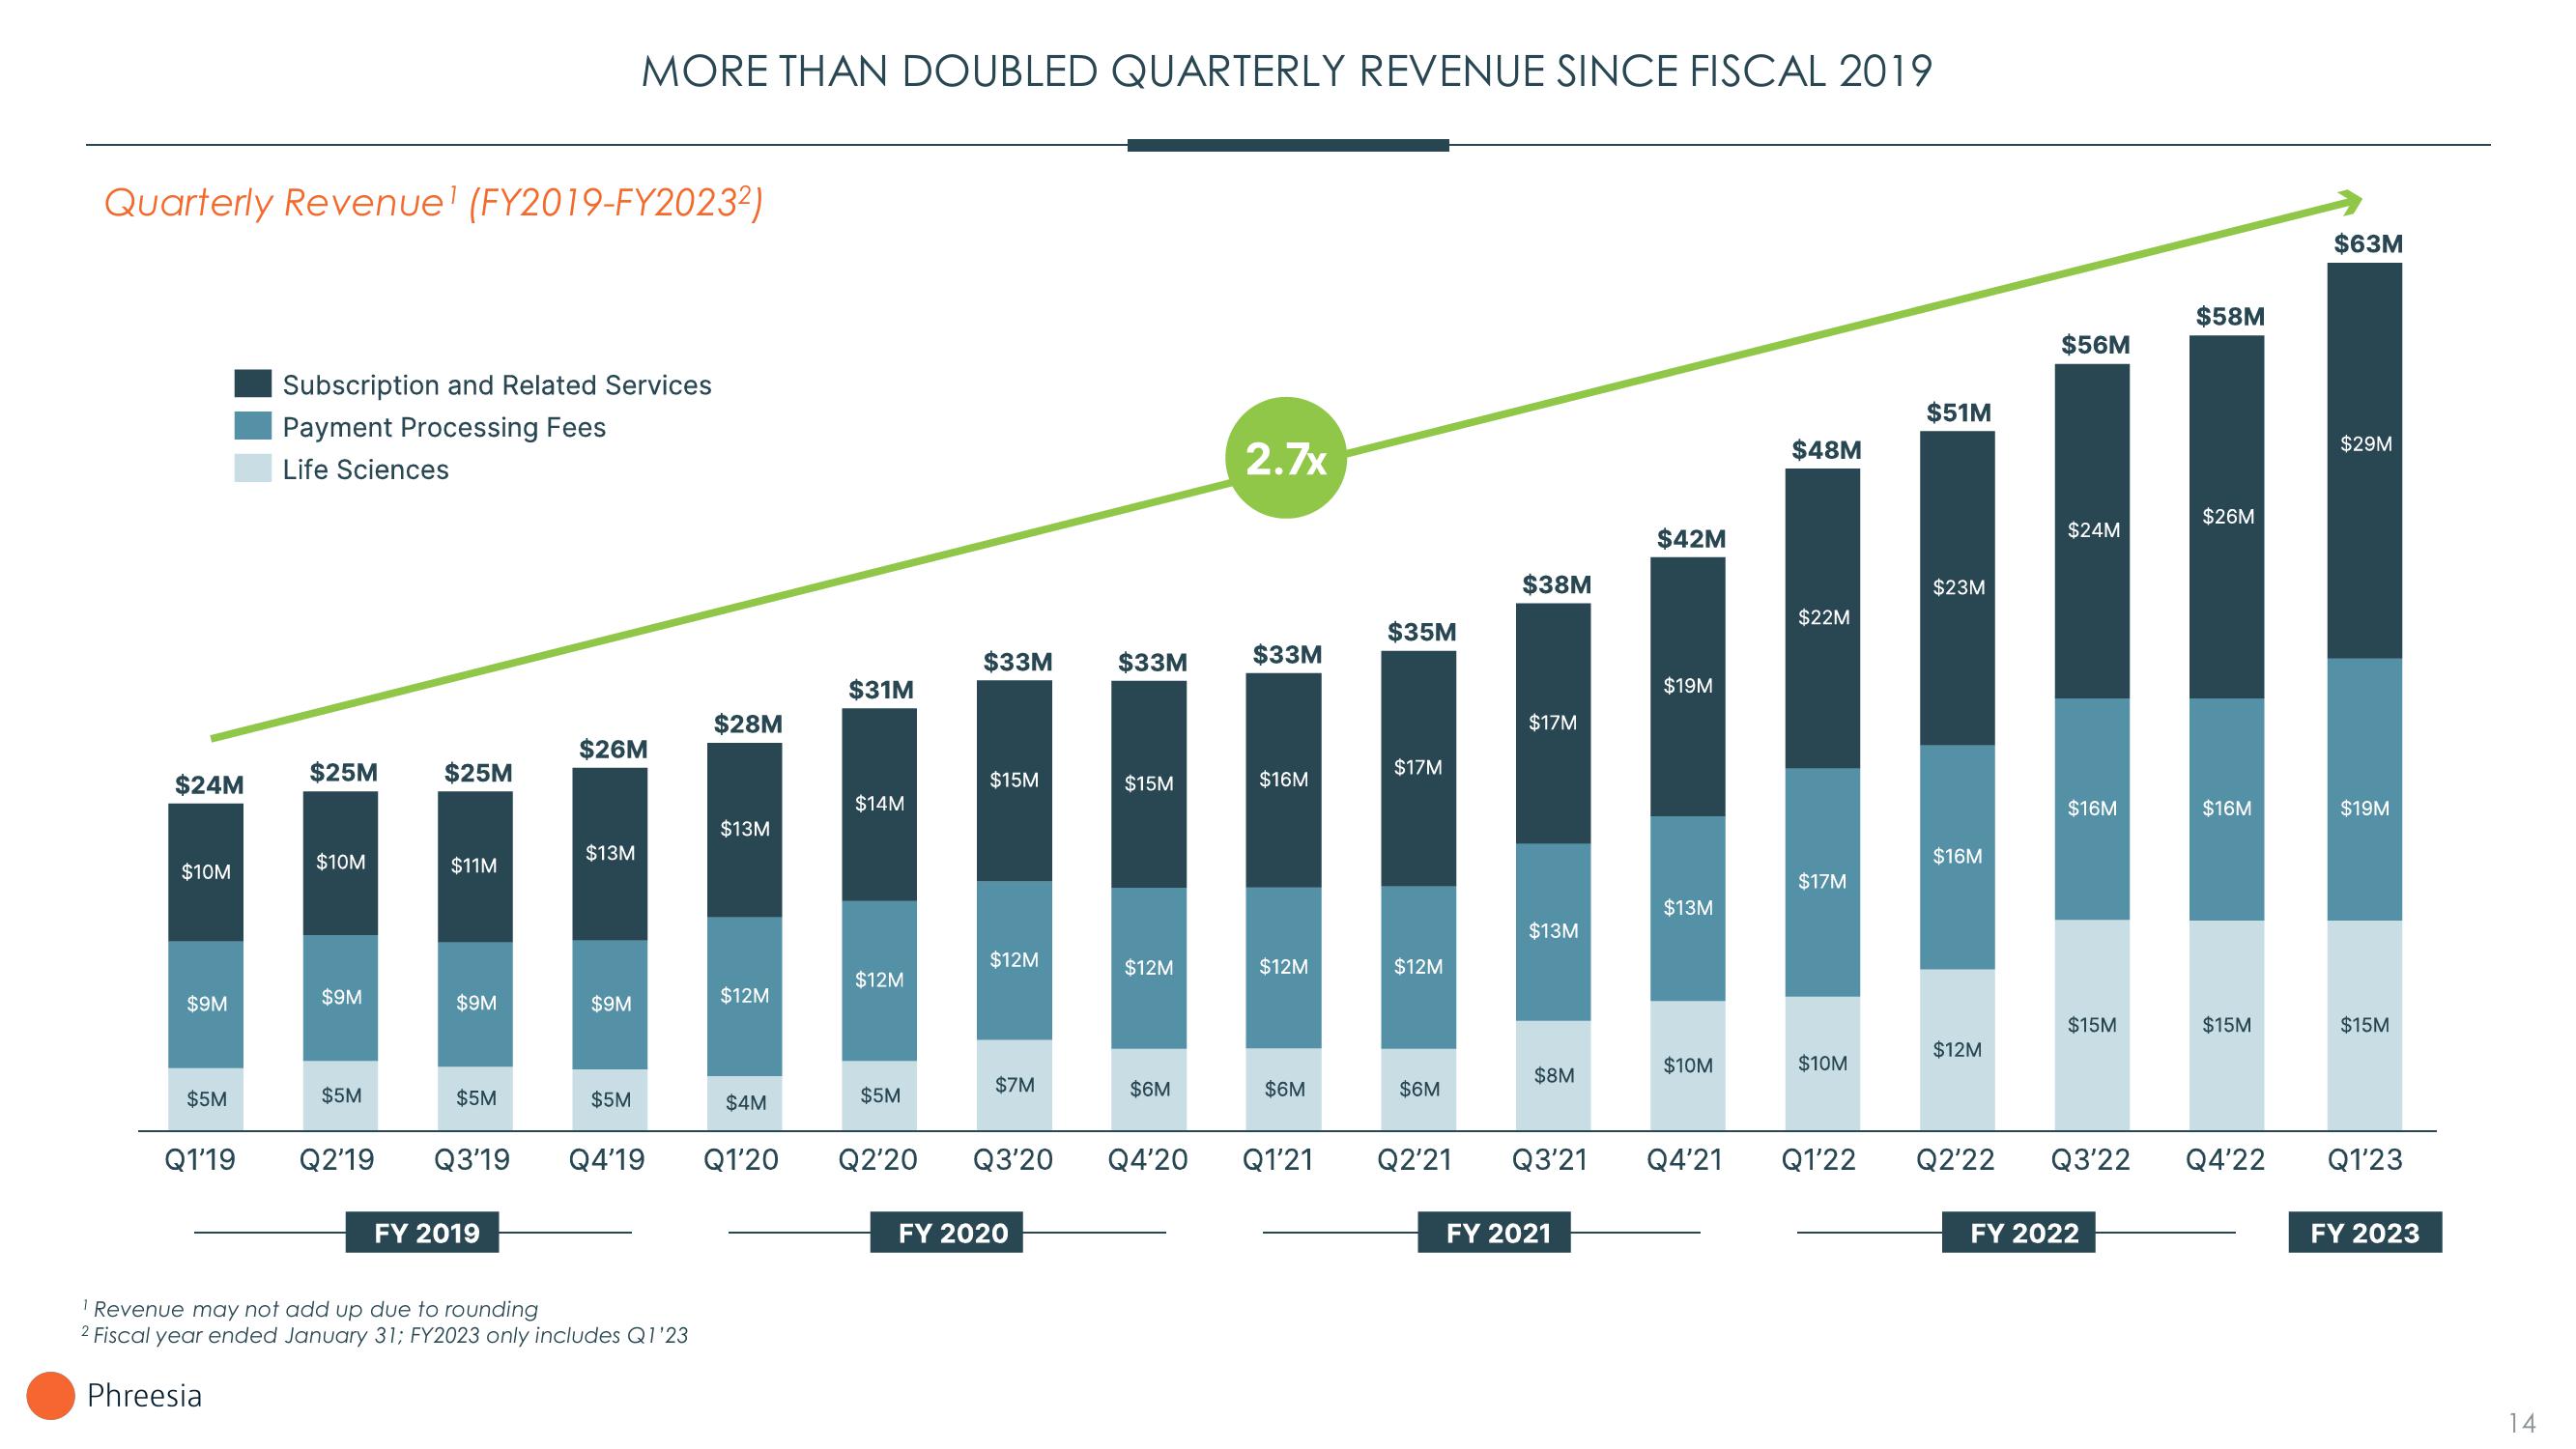
Quarterly Revenue¹ (FY2019-FY2023²)
$24M
$10M
$9M
$5M
Q1'19
Phreesia
Subscription and Related Services
Payment Processing Fees
Life Sciences
$25M
$10M
$9M
$5M
Q2'19
$25M
$11M
$9M
$5M
FY 2019
MORE THAN DOUBLED QUARTERLY REVENUE SINCE FISCAL 2019
$26M
$13M
$9M
$5M
¹ Revenue may not add up due to rounding
2 Fiscal year ended January 31; FY2023 only includes Q1'23
$28M
$13M
$12M
Q3'19 Q4'19 Q1'20
$4M
$31M
$14M
$12M
$5M
Q2'20
$33M
$15M
$12M
$7M
$33M
FY 2020
$15M
$12M
$6M
Q3'20 Q4'20
2.7x
$33M
$16M
$12M
$6M
Q1'21
$35M
$17M
$12M
$6M
Q2'21
$38M
$17M
$13M
$8M
$42M
FY 2021
$19M
$13M
$10M
Q3'21 Q4'21
$48M
$22M
$17M
$10M
Q1'22
$51M
$23M
$16M
$12M
$56M
$24M
$16M
$15M
$58M
FY 2022
$26M
$16M
$15M
Q2'22 Q3'22 Q4'22
$63M
$29M
$19M
$15M
Q1'23
FY 2023
14View entire presentation